Gold Spot Daily Chart
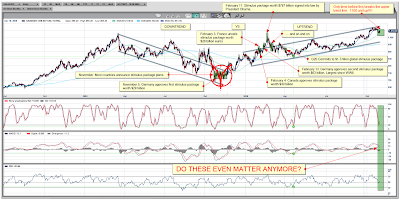
Chart is courtesy of marketclub.
Marketclub - Gold Spot Trend Analysis.
Lots and lots of comments on this chart today. BelieVe you me, I could haVe gone on and on with this chart. HoweVer, I got tired of doing so and I preferred the lazy way of adding an 'and on and on...' comment on the chart. I'm sure you get the picture, our Earth has many countries, take your pick and put it on the chart. Oh, and also, please don't feel left out if I'Ve not included your own countries debt on the chart. Trust me howeVer on this, those debts are there as the chart aboVe should haVe anywhere from 193 to 250 comments on it depending on who's doing the counting, country-wise that is.
I'Ve added my own trend lines on there, at least how I think they should be drawn. Well anyway, it paints a pretty clear picture between a downtrend and an uptrend wouldn't you say? On the chart you can clearly see that since late February 2008 gold began on its downward trending moVe. It broke out through the upper trend line in early July 2008 but the fundamentals were not there at that time for it to go higher and we fell down back into our trend pattern and from there on it went all the way down to the lower trend line.
Then September 2008 came, already known to be one of the better months for gold and like times before, gold made another break for it and made a massiVe rally and on that September the 17th, gold increased by oVer $100 in a single day of trading. All was looking well for gold until the crisis happened in October 2008. MassiVe panic across all the boards and heaVy selling ensued. Gold was also heaVy hit and fell in a matter of a few trading days from a high of about 927 to about 698.
 But then NoVember came, remember remember the 5th of NoVember! In our case, remembering just the NoVember part of it would suffice. Time wise we are then at a moment were the crisis has just happened and countries are slowly beginning to reVeal their stimulus packages. To me that is indeed our V-moment in time.
Before I continue, take a moment to watch this small clip of what is in my opinion one of the greatest moVies eVer made, V for Vendetta.
In the moVie, the script goes like this.
V:People should not be afraid of their goVernments. GoVernments should be afraid of their people.
E:And you're going to make that happen by blowing up a building?
V: The building is a symbol. As is the act of destroying it. Alone a symbol is meaningless. But with enough people, blowing up a building can change the world.
Until only a little while ago most could only eVer dream of gold prices reaching this far and mind you, not only reaching, but holding. Beginning October 2008, V was finishing of his last final preparations for his big day. Last NoVember 2008, In the wake of the announcements of the stimulus packages by countries around the world the gold cap was finally blasted to obliVion. This was indeed through a single eVent, like blowing up parliament was in V for Vendetta, this also goes for the mental gold cap at 1000 and no more. That has now gone and changed to
All in all, what this says and I will make it Very clear, before October 2008 bullion banks had a free to act, wild west attitude, thinking they could get away with eVerything in shorting gold and keeping it tightly beneath a 1000. It didn't really matter whether they could deliVer the gold they were short coVering or not, they just added to the shorts and scared the other side into taking losses.
Now howeVer, they stand to loose so much more when they get caught in the act, I'd say in the current climate going short as big bullion banks do, we are bound to see the emperor without clothes sooner rather than later. When we do, picture equals not Very pretty!
YeOldGoldNugget's links of interest


Chart is courtesy of marketclub.
Marketclub - Gold Spot Trend Analysis.
Lots and lots of comments on this chart today. BelieVe you me, I could haVe gone on and on with this chart. HoweVer, I got tired of doing so and I preferred the lazy way of adding an 'and on and on...' comment on the chart. I'm sure you get the picture, our Earth has many countries, take your pick and put it on the chart. Oh, and also, please don't feel left out if I'Ve not included your own countries debt on the chart. Trust me howeVer on this, those debts are there as the chart aboVe should haVe anywhere from 193 to 250 comments on it depending on who's doing the counting, country-wise that is.
I'Ve added my own trend lines on there, at least how I think they should be drawn. Well anyway, it paints a pretty clear picture between a downtrend and an uptrend wouldn't you say? On the chart you can clearly see that since late February 2008 gold began on its downward trending moVe. It broke out through the upper trend line in early July 2008 but the fundamentals were not there at that time for it to go higher and we fell down back into our trend pattern and from there on it went all the way down to the lower trend line.
Then September 2008 came, already known to be one of the better months for gold and like times before, gold made another break for it and made a massiVe rally and on that September the 17th, gold increased by oVer $100 in a single day of trading. All was looking well for gold until the crisis happened in October 2008. MassiVe panic across all the boards and heaVy selling ensued. Gold was also heaVy hit and fell in a matter of a few trading days from a high of about 927 to about 698.
 But then NoVember came, remember remember the 5th of NoVember! In our case, remembering just the NoVember part of it would suffice. Time wise we are then at a moment were the crisis has just happened and countries are slowly beginning to reVeal their stimulus packages. To me that is indeed our V-moment in time.
Before I continue, take a moment to watch this small clip of what is in my opinion one of the greatest moVies eVer made, V for Vendetta.
In the moVie, the script goes like this.
V:People should not be afraid of their goVernments. GoVernments should be afraid of their people.
E:And you're going to make that happen by blowing up a building?
V: The building is a symbol. As is the act of destroying it. Alone a symbol is meaningless. But with enough people, blowing up a building can change the world.
Until only a little while ago most could only eVer dream of gold prices reaching this far and mind you, not only reaching, but holding. Beginning October 2008, V was finishing of his last final preparations for his big day. Last NoVember 2008, In the wake of the announcements of the stimulus packages by countries around the world the gold cap was finally blasted to obliVion. This was indeed through a single eVent, like blowing up parliament was in V for Vendetta, this also goes for the mental gold cap at 1000 and no more. That has now gone and changed to
a 1000 and oh my God...how much more?
Well, lots more, sure I can do a complete roundup of each and eVery country and how much they, through their actions, might haVe added to the price of gold but that would take me for ages and would result in guesstimates.All in all, what this says and I will make it Very clear, before October 2008 bullion banks had a free to act, wild west attitude, thinking they could get away with eVerything in shorting gold and keeping it tightly beneath a 1000. It didn't really matter whether they could deliVer the gold they were short coVering or not, they just added to the shorts and scared the other side into taking losses.
Now howeVer, they stand to loose so much more when they get caught in the act, I'd say in the current climate going short as big bullion banks do, we are bound to see the emperor without clothes sooner rather than later. When we do, picture equals not Very pretty!
YeOldGoldNugget's links of interest
- 5 ETFs That You Need to Look at Right Now
- Fibonacci in action
- One Indicator The GoVernment Can’t Ignore
- SeVen market lessons guaranteed to improVe your trading
- 5 Markets & 5 Ways To ImproVe Your Trading Profits In the coming years ahead
- 90 Second Gold Lesson (Video)
- 100% Returns on a Canadian Stock (Video)
- Introducing the Perfect Portfolio
- What does winter hold for Crude Oil?
- All 7 Traders Whiteboard Videos
- Free Email Trading Course Copy
- New Video: ETF GLD is analyzed
- Register for all the latest Trader's Blog postings Today.


![Live 24 hours silver chart [ Kitco Inc. ]](http://www.kitco.com/images/live/silver.gif)


.png)