
Gold Spot Daily Chart
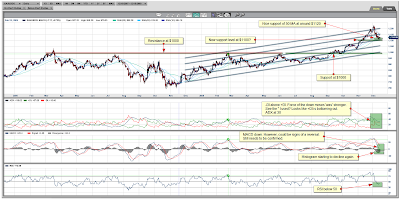
Chart is courtesy of marketclub.
Marketclub - Gold Spot Trend Analysis (What's this?)
Well, after doing my silver chart last night I also did the daily and weekly chart of gold but didn't get around at posting them. I now have a little bit more time so here it goes. The charts are from last night so gold was then still trading at $1124 and has as of this morning increased to around $1130.
So, the idea I had last night and earlier this week is only being confirmed. We are however still not in the clear. For that to happen I'd like gold to trade again above $1150. There could thus still be danger from breaking down.
But, looking at the chart, gold seems to have found support at the 50 MA around $1120. So that means the $1100 is hopefully slowly but steadily disappearing from our sights.
I've also drawn another support level at $1100 because of the action in mid November and the trend line which rests at that level now. So that means there is some additional support for gold here and that could thus explain why the 50 MA held and why gold is trading back up from here. Maybe more investors are seeing this as support?
From the chart you can see that the Average Directional Index has turned down since hitting our high of $1126.37 and the ADX went from over 40 to about 30 now which is still within acceptable boundaries for me. As you also can see, the +DI has now turned down and is now below the -DI. This means that the force of the down move (-DI) was stronger than the force of upward moves.
So, if I only was to look at the ADX indicator then this chart would be deemed negative...however looking at all other indicators makes me wonder if like silver, gold is not finding some support here, new momentum and a perhaps a fresh leg up from here?
MACD looks bearish and is turning down. However when I look at the histogram I see that one declining which also leads me to wonder whether this is looking to head back up?
RSI or Relative Strength Index tells me we are again in buy territory. Sure, we are not below 30 and thus not oversold but around 45 is plenty of room for gold.
Thus, to recap my daily, the same pretty much holds for gold as I indicated in my silver chart. In gold's case, we need to hold the $1100 and for silver we needed to hold the $17.00.
To me there are enough indications which could indicate that we should be looking up from here instead of further down. If gold however decides to move to $1100 and break the trend line then all bets are off and I will be forced to look at lower levels.
Gold Spot Weekly Chart

Chart is courtesy of marketclub.
Marketclub - Gold Spot Trend Analysis (What's this?)
On to the weekly then, this chart of course looks better than the dailyy cause the correction we had from the last couple of days just looks like a tiny blip on my weekly chart. Nothing to worry about anyway.
Weekly I'm still looking at my target of $1350.
The correction which started December the 2nd has brought us from $1226.7 down two trend lines and we are holding on the weekly 10 MA.
Weekly thus gold is still trading above all Moving Averages which is of course a good thing. Also, MACD tells me gold is still in an up trend as we are trading above the center line. There is a small correction noticeable in the blue line which is now turning down but that doesn't mean anything right now. Histogram has declined a bit which is a negative but looking back at the correction nothing to worry about and perfectly normal.
ADX on the weekly is clearly still bullish and the force of up moves is still far greater than the force of the down moves.
To summarize...YeOldGoldNugget is still looking at a bullish gold chart and combined with that some pretty exciting months bound to come.


Chart is courtesy of marketclub.
Marketclub - Gold Spot Trend Analysis
(What's this?) Well, after doing my silver chart last night I also did the daily and weekly chart of gold but didn't get around at posting them. I now have a little bit more time so here it goes. The charts are from last night so gold was then still trading at $1124 and has as of this morning increased to around $1130.
So, the idea I had last night and earlier this week is only being confirmed. We are however still not in the clear. For that to happen I'd like gold to trade again above $1150. There could thus still be danger from breaking down.
But, looking at the chart, gold seems to have found support at the 50 MA around $1120. So that means the $1100 is hopefully slowly but steadily disappearing from our sights.
I've also drawn another support level at $1100 because of the action in mid November and the trend line which rests at that level now. So that means there is some additional support for gold here and that could thus explain why the 50 MA held and why gold is trading back up from here. Maybe more investors are seeing this as support?
From the chart you can see that the Average Directional Index has turned down since hitting our high of $1126.37 and the ADX went from over 40 to about 30 now which is still within acceptable boundaries for me. As you also can see, the +DI has now turned down and is now below the -DI. This means that the force of the down move (-DI) was stronger than the force of upward moves.
So, if I only was to look at the ADX indicator then this chart would be deemed negative...however looking at all other indicators makes me wonder if like silver, gold is not finding some support here, new momentum and a perhaps a fresh leg up from here?
MACD looks bearish and is turning down. However when I look at the histogram I see that one declining which also leads me to wonder whether this is looking to head back up?
RSI or Relative Strength Index tells me we are again in buy territory. Sure, we are not below 30 and thus not oversold but around 45 is plenty of room for gold.
Thus, to recap my daily, the same pretty much holds for gold as I indicated in my silver chart. In gold's case, we need to hold the $1100 and for silver we needed to hold the $17.00.
To me there are enough indications which could indicate that we should be looking up from here instead of further down. If gold however decides to move to $1100 and break the trend line then all bets are off and I will be forced to look at lower levels.
Gold Spot Weekly Chart

Chart is courtesy of marketclub.
Marketclub - Gold Spot Trend Analysis
(What's this?) On to the weekly then, this chart of course looks better than the dailyy cause the correction we had from the last couple of days just looks like a tiny blip on my weekly chart. Nothing to worry about anyway.
Weekly I'm still looking at my target of $1350.
The correction which started December the 2nd has brought us from $1226.7 down two trend lines and we are holding on the weekly 10 MA.
Weekly thus gold is still trading above all Moving Averages which is of course a good thing. Also, MACD tells me gold is still in an up trend as we are trading above the center line. There is a small correction noticeable in the blue line which is now turning down but that doesn't mean anything right now. Histogram has declined a bit which is a negative but looking back at the correction nothing to worry about and perfectly normal.
ADX on the weekly is clearly still bullish and the force of up moves is still far greater than the force of the down moves.
To summarize...YeOldGoldNugget is still looking at a bullish gold chart and combined with that some pretty exciting months bound to come.
YeOldGoldNugget's links of interest
- New Video: S&P Going UP..or DOWN?
- New Video: Let’s Take a Fresh Look at Crude Oil
- New Video: Key Levels to Watch in the S&P 500
- New Video: The gold market continues to steam roll ahead!
- New Video: A look at the dollar index
- New Video: What do supertraders have in common
- New Video: Two Major Forces Collide in the Index Markets
- New Video: What’s Gold’s Next Stop?
- New Video: How long will Dow stay Bullish?
- New Video: Has Gold Topped Out for the Year?
- Has the S&P Index Topped Out for the Year?
- CRB Index insight video
- Are You Laughing or Crying About Markets?
- Introducing the Perfect Portfolio
- What does winter hold for Crude Oil?
- Free Email Trading Course Copy
- New Video: ETF GLD is analyzed


![Live 24 hours silver chart [ Kitco Inc. ]](https://lh3.googleusercontent.com/blogger_img_proxy/AEn0k_v70aeiolY7HrSW-0lNyztBOwG-vIq3dl0U3uz_bI1ehM1QR0p_gPVXEAq4gVokprZAexvRDm8ZzPkJIH2sfduCZdAK_8X1oCicTpiLajk=s0-d)


.png)


