Buy gold online - quickly, safely and at low prices
Showing posts with label Trend Channel. Show all posts

Tuesday, December 15, 2009

Is Gold Ready for its Next Move Up?

Gold Spot Daily Chart
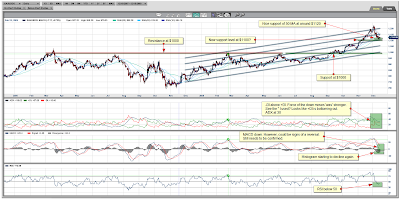
Gold Spot Daily Chart December 15, 2009
Chart is courtesy of marketclub.
Marketclub - Gold Spot Trend Analysis Marketclub - Gold Spot Trend Analysis (What's this?)

Well, after doing my silver chart last night I also did the daily and weekly chart of gold but didn't get around at posting them. I now have a little bit more time so here it goes. The charts are from last night so gold was then still trading at $1124 and has as of this morning increased to around $1130.

So, the idea I had last night and earlier this week is only being confirmed. We are however still not in the clear. For that to happen I'd like gold to trade again above $1150. There could thus still be danger from breaking down.

But, looking at the chart, gold seems to have found support at the 50 MA around $1120. So that means the $1100 is hopefully slowly but steadily disappearing from our sights.

I've also drawn another support level at $1100 because of the action in mid November and the trend line which rests at that level now. So that means there is some additional support for gold here and that could thus explain why the 50 MA held and why gold is trading back up from here. Maybe more investors are seeing this as support?

From the chart you can see that the Average Directional Index has turned down since hitting our high of $1126.37 and the ADX went from over 40 to about 30 now which is still within acceptable boundaries for me. As you also can see, the +DI has now turned down and is now below the -DI. This means that the force of the down move (-DI) was stronger than the force of upward moves.

So, if I only was to look at the ADX indicator then this chart would be deemed negative...however looking at all other indicators makes me wonder if like silver, gold is not finding some support here, new momentum and a perhaps a fresh leg up from here?

MACD looks bearish and is turning down. However when I look at the histogram I see that one declining which also leads me to wonder whether this is looking to head back up?

RSI or Relative Strength Index tells me we are again in buy territory. Sure, we are not below 30 and thus not oversold but around 45 is plenty of room for gold.

Thus, to recap my daily, the same pretty much holds for gold as I indicated in my silver chart. In gold's case, we need to hold the $1100 and for silver we needed to hold the $17.00.

To me there are enough indications which could indicate that we should be looking up from here instead of further down. If gold however decides to move to $1100 and break the trend line then all bets are off and I will be forced to look at lower levels.

Gold Spot Weekly Chart
Gold Spot Weekly Chart December 15, 2009
Chart is courtesy of marketclub.
Marketclub - Gold Spot Trend Analysis Marketclub - Gold Spot Trend Analysis (What's this?)

On to the weekly then, this chart of course looks better than the dailyy cause the correction we had from the last couple of days just looks like a tiny blip on my weekly chart. Nothing to worry about anyway.

Weekly I'm still looking at my target of $1350.

The correction which started December the 2nd has brought us from $1226.7 down two trend lines and we are holding on the weekly 10 MA.

Weekly thus gold is still trading above all Moving Averages which is of course a good thing. Also, MACD tells me gold is still in an up trend as we are trading above the center line. There is a small correction noticeable in the blue line which is now turning down but that doesn't mean anything right now. Histogram has declined a bit which is a negative but looking back at the correction nothing to worry about and perfectly normal.

ADX on the weekly is clearly still bullish and the force of up moves is still far greater than the force of the down moves.

To summarize...YeOldGoldNugget is still looking at a bullish gold chart and combined with that some pretty exciting months bound to come.

Buy gold online - quickly, safely and at low prices
YeOldGoldNugget's links of interest

Buy gold online - quickly, safely and at low prices

Will Silver Bounce Back Before Christmas?

Silver Spot Daily Chart
Silver Spot Daily Chart December 15, 2009
Chart is courtesy of marketclub.
Marketclub - Silver Spot Trend Analysis Marketclub - Silver Spot Trend Analysis (What's this?)

I'm looking at the daily chart here, December the 15th on our 349th day of the year with only 16 more to go before we take silver into 2010.

Now, looking at the daily chart, I must honestly confess, I've seen better. Yes, at December the 11th we've hit a new 3 week low of $16.91. Yes, we have been trading down from our high of $19.45 which was put on the boards at December the 2nd and have traded down from then. Yes, we are trading below our Moving Averages.

However, to me, that only shows that we could be very near a turning point which does not mean I'm indicating a bottom here. Don't get me wrong, what I'm saying is, the market could find a bottom here. Like me, others look at the same charts and find the same lines, resistances, supports, pivot points, 8 year cycles, 12 year cycles,... And to me, unless I fail at drawing computer generated straight lines in a...well...straight line...then the chart is telling me we could indeed be at such a point.

So, when I say, NO, I'm not indicating a bottom, I'm also saying, either we go up from here or we break the trend line. So, that still leaves us both options.

Which do I favor or rather think more likely to happen from here?

Well, personally and chart wise I'd say we very well could go up from here. So my guess is there will surely be many investors who will take the figuratively speaking plunge into a silver long investment. When some do, that will cause a ripple and more will follow. It is the way of the market.

I'm already hearing about March 2010 silver prices going as high as $22.00. So, already the market is looking at way higher prices than what we are now looking at.

So,...is a $22.00 silver price in March 2010 realistic?

Well, the answer to that question would be...PRETTY MUCH YEA!

Like gold, silver CAN, HAS and WILL again in the near future perform like it seems there is nothing holding it back. Just take a look at the beginning of September when gold started moving away from the $1000 level, silver was trading at September the 1st with a low of $14.62 moving all the way up to September the 17th to finish off with a high of $17.65. At that very same time gold had only made a high of $1024.

Seasons Greetings Bar Silver - 2009 Copyright Northwest Territorial MintNow, I'm sure not all of my readers are math geniuses but I think you'd have to agree that getting from $14.62 to $17.65 is more of an increase than getting from $1000 to $1024? I think silver made about a 18% gain while gold had to settle for a mere 3% gain.

So, yes, I like the shiny gold, I admit! And yes, it is more precious but for my normal investments, like shares and the junior market I prefer the leverage I get in silver over gold.

It's just personal preference I suppose.

So, to continue with the chart and my motivation for my comments, well, you see, first and foremost if we break $17.00 from here...and with the emphasis on here...then I really don't know where this has to go, daily then. Only to say that from here on down and below $17.00 would be Christmas Silver Shopping Season.

MACD looks to be heading back up and the histogram already is showing signs of starting to decline back to zero and hopefully above the center line again. Now, it is too early to tell but it is on the chart so, the downward momentum has definitely decreased. Whether this holds I honestly don't know but the latest about the rising wholesale prices and the inflation fears will put an additional level of support under gold and silver?

To end my daily chart, plain and simple, there is more support to be found around these prices than there is resistance. Like electricity, silver will go the way of least resistance...that in my opinion is UPWARDS!

Silver Spot Weekly Chart
Silver Spot Weekly Chart December 15, 2009
Chart is courtesy of marketclub.
Marketclub - Silver Spot Trend Analysis Marketclub - Silver Spot Trend Analysis (What's this?)

On to the weekly then, well for one, there is the $16.00 support level which is a very nice thing to have. Since, earlier it was a resistance, now that we are steadily trading above that level it will act as support like it has in the past.

Why bring up the $16.00? Just to show that if silver does manage to break the trend line then $16.00 is the number I'm looking at to look for a bounce back up. Nothing wrong with being prepared either way,...is there?

For now, I will remain looking up and not down! We are still trading upwards and still in a clearly definable up trend. We are also still trading in our trend channel all be it that we are now at the bottom of our lower trend line.

Most important thing is, we are holding as you've seen daily and weekly.

So, not much more I can say here. We need to look for confirmation of this thing wanting to go higher from here. Silver could trade sideways for a bit longer before heading back up. Anything above $17.00 is still bullish, getting to far below $17.00 would be bearish and should put investors in alert mode.

So, to answer the question, will silver bounce back before Christmas? Well, it is already sorta doing that. Only thing left to do from here is get back to our earlier high of $19.45 and leave the under $19.00 zone behind us and in thus doing so creating a bottom and support at $19.00.

Lets take this one step at a time though, that means, daily, lets get back above $18.14 first and then look again.

Buy gold online - quickly, safely and at low prices
YeOldGoldNugget's links of interest

Buy gold online - quickly, safely and at low prices

Friday, December 4, 2009

The Good, The Bad and The Ugly

Let me start off this article by introducing to you, Clint Eastwood as Blondie. The Good, a.k.a. the Man with No Name, a subdued, cocksure bounty hunter who competes with Tuco (The Ugly) and Angel Eyes (The Bad) to find the buried gold.

Blondie and Tuco have an ambivalent partnership. Tuco knows the name of the cemetery where the gold is hidden, but Blondie knows the name of the grave where it is buried, forcing them to work together to find the treasure. In spite of this greedy quest, Blondie's pity for the dying soldiers in the chaotic carnage of the War is evident. "I've never seen so many men wasted so badly," he laments.

Coincidentally in my story to drive the point home, Blondie aka The Good is represented by the HUI Index and the Gold Spot charts while Tuco aka The Ugly is represented by the Dollar. Blondie and Gold...that can't be a coincidence. Gold vs The Dollar. Anyway, beneath each chart I will try to explain why I believe the chart belongs in either The Good, The Bad 'or' The Ugly.

The Good

HUI Index Daily Chart
HUI Index Daily Chart December 04, 2009
Chart is courtesy of marketclub.
Marketclub - HUI Index Trend Analysis Marketclub - HUI Index Trend Analysis (What's this?)

Gold Spot Daily Chart
Gold Spot Daily Chart December 04, 2009
Chart is courtesy of marketclub.
Marketclub - Gold Spot Trend Analysis Marketclub - Gold Spot Trend Analysis (What's this?)

Why classified under The Good? Just take a look at the HUI Index chart, take a look at the steady rise never failing to break from beyond its original trend channel from where it started early on in January 2009. Not only that, this week we came $2 dollars short of reaching the all time high. I'd say that qualifies as strong performance. The failing to break the all time high is like I said, just that, stocks don't have to break all time highs in one straight move. Maybe one, two or three attempts.

At least that index managed to get back to earlier highs.

Now on to gold...do the terms 'historic gains' mean anything? I don't really mind the little bumps or a possible correction, what must be done must be done. Like with the HUI, this will just be a correction, not the start of golds downward march to 984.

The Bad

S&P Daily Chart
S&P Daily Chart December 04, 2009
Chart is courtesy of marketclub.
Marketclub - S&P Index Trend Analysis Marketclub - S&P Index Trend Analysis (What's this?)

Nasdaq Daily Chart
Nasdaq Daily Chart December 04, 2009
Chart is courtesy of marketclub.
Marketclub - Nasdaq Trend Analysis Marketclub - Nasdaq Trend Analysis (What's this?)

Dow Jones Daily Chart
Dow Jones Daily Chart December 04, 2009
Chart is courtesy of marketclub.
Marketclub - Dow Jones Index Trend Analysis Marketclub - Dow Jones Index Trend Analysis (What's this?)

So, The Bad! What do these charts have in common? They all to me at least, show choppy performance, failing to reach earlier highs is one. Second is, they are all showing signs of a market in disarray. A market in doubt. Will it go higher or will it go down? A market that is tiptoeing along...every leaf, twig or little pebble will set off the noise and release the evil bloodhounds...leaving everybody running for the exits...so to speak.

Angel Eyes / The Bad / Lee van CleefMethinks, the debt package and stimulus money is running out...nothing like an inflated job report to try to stave off any possible drop. However, there is more needed than an inflated job report to continue this path.

I'm not convinced. I'd be careful, that's all. The Dow Jones even has a rising wedge in there which if confirmed does not bode well.

The Ugly

US Dollar Daily Chart
US Dollar Daily Chart December 04, 2009
Chart is courtesy of marketclub.
Marketclub - US Dollar Trend Analysis Marketclub - US Dollar Trend Analysis (What's this?)

On to the almighty Dollar, the greenback, the world-currency, the safe-haven,...at least, that is what it once was known as.

Tuco / The UglyAlmighty? NOT compared to what I can see from other currencies!
Greenback? Last time I checked they were still green.
World-currency? NOT for long!
Safe-Haven? NOT what I can see from gold's chart.

Summary

Now, I'm not per definition saying the markets are going down but I'm just stating and showing you what is on the charts. If they break those resistances then fine, none the wiser and we move on. However, if there does seem to be a reversal going on, then people and investors will, like they did before, take the money off the table. Will that money then go to the dollar or the treasuries...or will that money flow into gold, silver and the commodities?

We all know who came out on top in the movie,...don't we?


YeOldGoldNugget's links of interest

Wednesday, December 2, 2009

Gold's Relentless March Continues!

Gold Spot Daily Chart
Gold Spot Daily Chart December 02, 2009
Chart is courtesy of marketclub.
Marketclub - Gold Spot Trend Analysis Marketclub - Gold Spot Trend Analysis (What's this?)

Since I did my last chart I've been doing some minor adjustments to my trend lines. Only minor ones as you'll see. Just compare the two daily charts for a moment.

Only difference is, the trend lines now align perfectly and every other one is 50 points away from the next one. I don't know whether this is a coincidence to have them lining up so perfectly but there are too many points to highlight on the chart which sorta rules out coincidence...at least to me.

For instance...the bottom trend line started November/ December 2008 at around 750 (low to be exactly 756,20 at December 07, 2008). Were we to follow that trend line until now we would indeed with the combined normal trading action have hit the 1000 mark around September / October 2009.
Also from the chart you will see the upper trend line being hit in February 2008, on February the 20th to be precise. If I use that high and draw a new trend line parallel with my other trend line and also at exactly 50 points from the lower one (the 4th), take a look where gold took a breather from a couple days ago!

On November the 24th I posted an alert on my stock-house blog to let my readers know that a possible dip was coming. You can now see why!

Sure, it could break the upper trend line straight away but always better to take some profits off the table. That way you have some funds available to buy stocks on the low if it does turn down.

On with the chart, you'll see that from the beginning of November gold has broken through several trend lines, three to be precise. Now, if you know that each channel represents 50 points than that gives you 3 x 50 which equals 150 points increase already since the beginning of November when we were still trading at 1050.

So, starting from 1050 in early November, 3 channels up gives us 1200. Now from the chart you'll clearly see that it broke short of the 1200 and after hitting 1195 started trading down. It was a quick pullback which coincided with the Dubai debt issue seemed like a very violent correction as it went down and hit a low of 1136, a little bit under the lower trend line. Gold was quickly brought back up again and together with the 10 MA as support was quickly making its way to the upper most trend line again and has since yesterday clearly broken it.

Gold Bar - BullionVaultTrading now around $1215, so definitely above the upper trend line which sorta leaves me wondering where this is going to end? In my last article I indicated getting to 1200 would be no problem. From the looks of things I'd say no problem indeed!

So now what?

Well, from the chart you'll see already on the daily we are a whopping $232 away from the Moving Average 200 ;-)
Don't know if this is a record or not since my charts only go back for 10 years but from what I can see on the daily in those 10 years....IT IS!!!

Does that mean I'm now looking downwards for gold? HECK NO!

No time to be betting against gold right now, no matter what RSI or MA tells you. At least, that's what I think. If mean, if you see gold moving up channel after channel, gaining 50 points in a couple of days and another 100 points over the course of less than a month with no signs of even looking back to the carnage it is wreaking havoc upon amongst those who are short.

Golden HAVOC!

So, does the daily chart please YeOldGoldNugget? A WHOLEHEARTEDLY YES! It is the relentless action of gold, the maybe historic gains gold is making now. Not simple factors to ignore, my 2 gold nuggets.

Gold Spot Weekly Chart
Gold Spot Weekly Chart December 02, 2009
Chart is courtesy of marketclub.
Marketclub - Gold Spot Trend Analysis Marketclub - Gold Spot Trend Analysis (What's this?)

Weekly is where gold does its magic! Is it magical? Well, can't you see the magic going on in the weekly chart? I sure can!

Again, mind you, I can only look back 10 years in market club and from what I can see gold has never seen such strong performance like it has these last two months. Absolutely amazing to say the least!

From the chart you can see we are still or could still be completing our head and shoulders pattern which we broke out off from the beginning of October 2009, That alone gives us a long term price indication of about 1300 to 1350.

Looking at the MACD,...if ever someone needed to write a book and describe one of the most bullish of MACD's then surely gold's MACD or something similar would be shown. Blue line above red line, wide gap ever increasing, steady increase is also shown in the gray divergence cubes which increase steadily over time. That is just what one needs to see and will always see when a stock or index is undergoing a strong uptrend.

I've added another indicator, the Average Directional Index, this can determine trend strength regardless of the market direction. This non-directional oscillator is based on a range of 1 to 100 (although movements over 60 are rare). If the line is under the 20 mark, the trend is considered to be weak. If the line is above the 40 mark, the trend is considered to be strong. The ADX line is built on the results of two separate technical indicators, the +DI (force of up-moves) and the –DI (force of the down-moves). The default for this study is 14 periods which takes into the consideration the measurements of the +DI and –DI for the last 14 periods.

Knowing that and looking at gold's ADX chart you can clearly see the +DI above the ADX which indicates a trend upwards. ADX is also looking to go higher.

Gold Bar - BullionVaultIf gold keeps up its relentless action which it, looking at the weekly chart, is bound to do then by February 2010 we might already be looking at 1300 or more.

Stranger things have happened.

I think we have a clear winner here! Gold...and silver...bound to astonish most and catch many off-guard and with their pants down.

To finish my article I'll give a couple supports daily and weekly.

On the daily we have support from either the 10 MA at 1184, the 30 MA at 1129. I'm disregarding the 200 MA (984) for obvious reasons. Of course, there are also the trend lines to look for to offer support, 1200, 1150, 1100,...

On the weekly we have support (and also from the trend lines) from either the 10 MA at 1096, the 30 MA at 1002. I'm disregarding the 200 MA (788) for obvious reasons.


YeOldGoldNugget's links of interest

Sunday, November 8, 2009

Orko Silver Chart November 06, 2009

Orko Silver Daily Chart
Orko Silver Daily Chart November 06, 2009
Chart is courtesy of marketclub.
Marketclub - Orko Silver Corp. Trend Analysis.

Nice action on Friday. We had Orko Silver opening at 0.99 which sadly didn't last for very long it seemed at first. Well, if you take a look at the Kitco silver chart you'll see from the red line that silver got pulled down from 17.55 to 17.35 but then rallied again to 17.60.

If you take a look at the 5 day chart in Google for instance, you'll notice Orko Silver following the drop and rise perfectly. Now that does not mean that Orko Silver is a good silver indicator. Hardly! But taking a look at the following charts shows that at least since the last two months Orko Silver is again following the price of silver.
Orko Silver Daily Chart November 06, 2009
Silver Spot Daily Chart November 06, 2009Continuing with the chart, from the MACD diagram you can clearly see a bullish crossover is appearing on the chart which is of course a positive sign. A little past eleven we had a little handshake with 1.00 after which we said goodbye and started trading lower until we reached 0.94, our low of the day at around three o clock. So, to get Orko Silver to drop from 1.00 to 0.94 took about 55K shares being upped for sale of which 17.5K were actually sold. A last minute buyer managed to buy some 1500 shares and pulled us up right back to where we started from and thus to a close of 0.96.

Orko Silver Corp Level 2 Quotes - Hotstocked.comYou can also see from the chart and the trend lines I've drawn that since this week Orko Silver has broken out of its downward sloping trend channel. That happened on November the 3th on which we saw Orko Silver opening at 0.86 and closing at 0.97, gaining 0.11 cents. So that was the break. The following days we've been holding above 0.95 and last Friday might possibly be the start of a confirmation of Orko Silver finally making a break, a close and a hold above 1.00.

One only has to look at two points, September the 18th, large volume of 2.5 million, a break above 1.00 but no continuation, October the 14th, large volume of 1.1 million, a break above 1.00 but no continuation.

After these two we look out for our third one, November the 6th, only a little brush with 1.00 and insignificant as our third day,...waiting thus for the next day with big volume.

I'll tell you this, the next move with the right volume not only will bring us over 1.00, it will also keep us above 1.00 this time around. So, what am I expecting from Monday? I expect Orko Silver to make another break for the 1.00. If you happened to read my last article on Gold Breaking Out of Upper Trend Channel then I'm sure you know how I feel about it.


YeOldGoldNugget's links of interest
Buy gold online - quickly, safely and at low prices

Saturday, November 7, 2009

Gold Breaking Out of Upper Trend Channel

Gold Spot Daily Chart
Gold Spot Daily Chart November 06, 2009
Chart is courtesy of marketclub.
Marketclub - Gold Spot Trend Analysis.

Lets start by taking a look at the daily chart of gold. As you'll notice I've marked some important highlights on the chart. The bigger, the upper and the lower trend channel are of importance. I've only ever seen others using the lower channel and that is something that I do not get? Why limit yourself, why limit gold in such a narrow space while the last couple of months have shown and proven that gold is ready and has been ready since 2008 to get into a higher trend channel. The lower and center one just...

DO NOT QUALIFY ANYMORE!

I think we have passed that time frame. When I wrote my article at the beginning of October 2009 I was not kidding with the Neon signs.

You can see from the chart why I started using the bigger trend channel. If you take a look at December 2008 you'll see gold made 2 runs for the upper trend line. After the first rally gold consolidated to the 10 MA line and after the second rally gold consolidated to the lowest trend line. From that point which is around January 15, 2009 gold starts to move to the upper trend line and hitting the upper trend line the 23th of January. If you look closer you'll see from that moment that gold keeps trading on or around that upper trend line and does so till we reach February the 10th, 2009.

Johnson Matthey 1-Kilo Gold Bars - Copyright © 2009 Northwest Territorial MintGold then again rallies further above the upper trend line before hitting a high of about 1006 on February the 20th, 2009. It then drops to...AGAIN...the upper trend line and keeps trading at that level for several days until we hit March the 19th, 2009 and reach a point where gold makes a drop towards the lowest trend line. It then plays a bit with the lower trend channel and reaches a low at April the 19th, 2009. Gold starts to rise again and this time back to the upper trend line. It does so, not in a straight line up but with a lot of trading around the center or rather the upper trend line of the lower trend channel.

Gold reaches the upper trend line around the start of June 2009. It then drops again with as target the lowest trend line but only drops after maintaining a 15 day close contact with the center trend line before saying goodbye to it and at the start of July 2009 we see gold moving away and dropping towards the lowest trend line and hitting that, July the 12th, 2009.

From this moment, July the 12th, 2009 could very well be the last time gold is trading in this lower trend channel and thus the lower prices. As you will see from the start of September 2009 there is a break from the lowest trend line, keeping tight contact with the center line before reaching October 2009 and making a break for the upper trend line, consolidating only once in the process. That happened just last week and now we're already firmly back at the upper trend line and as of November 3, 2009 we have broken the upper trend line and have kept above it for 3 days now.

MACD looks good. You'll see that MACD keeps making higher and higher bottoms which is very bullish to put it mildly. RSI only just reached overbought but as you can see and as I've explained before, gold can stay in overbought zone for days and weeks on end. When fundamentals are strong then forget about looking at RSI, better then to look at Stochastics. To each their own of course. Whatever works for you.

Let me continue with the weekly chart.

Gold Spot Weekly Chart
Gold Spot Weekly Chart November 06, 2009
Chart is courtesy of marketclub.
Marketclub - Gold Spot Trend Analysis.

OK, the weekly chart, this is where we establish and confirm the trend AND direction. Read the highlights and then tell me what you think what all that means and where you reckon gold will go to next? Up or down? 1500 or 750? Who's with me on the 1500? You'll see from the start that September 2007 gold started rallying and didn't stop until it gained...

A WHOPPING 350 POINTS

That brings us to the big consolidation starting around mid March 2008 and bottoming out at the height of our crisis in October 2008. You will remember remember, the 5th of November 2008 or rather the months when all the stimulus package were announced and in fact the very same months that the printing presses were doing overtime.

Sure, it has been a bumpy ride but if you look from the weekly chart, gold not only broke out of our weird Elephant man's right shoulder at the beginning of October 2009 but gold also remained firmly held between the trend lines of the greater trend channel and has since this week broken the upper trend line and is holding above it.

Now, does YeOldGoldNugget dare to say that we are now again at a possible breaking point?

YOU BET YA

Maybe something like what happened at the start of October 2009, maybe a bigger move? Will that rally start right now or will we first make a consolidation? Who knows? One thing I do know, time to go short or bet against rising prices,...probably not THE smartest of things to do right now. If not something you take from this article then maybe this would be a good one to remember.

Also, one of the things most people throw around as argument, or basically because they really don't get it, anyway, it goes like this, 'Gold is just another bubble'...is what they say.

You know what YeOldGoldNugget says about that?

Empty Gold BalloonI'd say we are about this far in our bubble (See image for visual representation). Oh, Oh, Oh, but but...is how it goes when I counter argument them...before they slam another totally idiotic remark my way.

You really have to be sitting down before you read this, better yet, secure yourself firmly to your seat before reading their next moronic argument. Ready for it?

Just see what happened to oil when it reached $147!

Yeah yeah, that might very well be about oil being a bubble, but comparing gold to oil? Comparing gold, a substance which is so rare, which has been used throughout ages and centuries as a precious commodity and a means of preserving wealth. A substance which not only is rare but is rare for a very specific and just meaning. Gold is not formed on this planet, it is formed in our universe. Also, when I say universe I'm actually undervaluing the rarity.

SupernovaGold is not just created in the universe, for gold to come into existence, enormous forces are required. Not even the forces of nuclear fusion working frantically in the center of stars suffice for gold's needed reaction to happen. No! For that to happen we need our stars to go SUPERNOVA!

Only then are circumstances at an ideal for gold to be formed. And no, YeOldGoldNugget is not sucking this one from his thumb. There are some great study's which have been done about the necessary requirements to create gold.

Well, don't know whether you heard the story about turning lead into gold? Turns out those alchemists or transmutationists of back in the days might have not been that stupid at all...at least not in their thinking pattern. Turns out they started with the wrong compound - and a tad short on the required energy - but were right about the process being a possibility. It is thus actually possible to create gold on this planet. Not by using lead mind you but by using an isotope like mercury.

And that is just the start of your efforts, that was the cheapest part by the way, the mercury. However, mercury or Hg as its known from the periodic table has 80 protons. Gold or Au has 79 protons. So, mercury seems to have one proton to many! But since it is the closest family to gold, a prime candidate for our experiment. Sadly, to get mercury to ditch its 80th proton we need a process called electron capture which is performed in a nuclear accelerator. Bombarding our mercury with enough high-energy neutrons will do just that...leaving us with pure gold!

AlchemistSo yes, those alchemists were quite right, however, turns out if they were looking to create a penny's worth of gold from mercury it would take them and are you ready for this... 1,000,000,000,000,000,000,000,000 years. I do not take credit for the calculation, for that you need to contact Barry L. Berman who is a physicist at George Washington University.

Oh oh oh, I hear, and what about gold's other closest family in the periodic table. 'Left' next to gold so to speak. Who is Mr. Proton 78 looking to trans mutate into Mr. Proton 79? Well, turns out its quite a familiar presence.

Meet Mr. Platinum! Trading at or about $1340. Hm? Using something which is valued at $1340 to create something which is -now- valued at $1090? Well, it is scientifically possible but needless to say...even costlier than using mercury.

This following calculation was found on the Cosmic Conservative website.

The best estimates I’ve seen put the total weight of gold ever mined to be about 160,000 tonnes. A tonne is 1,000 kilograms, so that’s 160,000,000 kilograms. Gold weighs 19.3 grams per mililiter. A mililiter is one cubic centimeter. 160,000,000 kilograms is 160,000,000,000 grams. Which comes to roughly 8,300,000,000 cubic centimeters. There are 1,000,000 cubic centimeters in a cubic meter, so that means the volume of all the gold ever mined is about 8,300 cubic meters of gold. That’s roughly a cube of solid gold 20 meters on a side, or about 65 feet on a side.

In other words, all of the gold ever mined in the history of the earth would fit in a moderately sized house.

So, whenever you hear someone mentioning those two ridiculous claims towards gold then you'll know what to tell them! Comparing oil, a mix of naturally occurring organic compounds from within our earth and which are basically made up of nothing more than hydrogen, carbon and oxygen...TO GOLD? Heretics! The nerve of some people! Any reason is reason enough to drag gold down I suppose. Good luck with that trading strategy in the coming years ROLF :-)

Buy gold online - quickly, safely and at low prices
YeOldGoldNugget's links of interest
Buy gold online - quickly, safely and at low prices

Wikinvest Wire


Watch INO TV for FREE now.

Orko Silver Corp. Chart


MarketClub Free Trial - Tools for the Trader

24 Hour Spot Silver (Bid)

Live 24 hours silver chart [ Kitco Inc. ]

Buy Gold Online - BullionVault

Buy gold online - quickly, safely and at low prices

Educational Videos - Market Analysis

Watch the latest educational videos from MarketClub by Adam Hewison