
Orko Silver Daily Chart
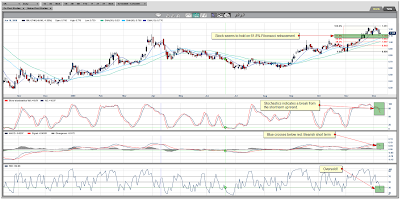
Chart is courtesy of marketclub.
Marketclub - Orko Silver Corp. Trend Analysis (What's this?)
Last time I did another article, Orko Silver was still on its breakout to its new recent high of 1.25. Since 1.20 was my initial target I'll settle for 1.25. From the MACD you could already see the divergence decreasing these last days and on the 7th of December Orko opened at 1.13 which was below the 10 Moving Average.
Not all that strange considering current events, gold and silver correcting, the dollar experiencing a little Frankenstein moment which will have its effect on the stock market. But not withstanding those events, Orko Silver has kept a steady pace finding support at the 61.8% Fibonacci Retracement.
Short term I see a bearish MACD crossover on the chart. It will remain to be seen whether we will go sideways from here or whether we break the support we seem to have around 1.14? That all depends on how far a correction we will get in gold and silver I suppose.
Till now Orko has kept up quite well if not beyond expectation!

Only one reason for that my opinion then...lots of backing and lots of support for Orko Silver from the market. Whether amongst investors or amongst fund managers. Orko Silver is not easily cast away like some other stocks. With this I mean, if push comes to shove and certain funds need to be freed, Orko Silver will probably come last on that list rather than first.
What also leads me to this rather bold statement? Well,..
Support from the 30 MA at 1.06, the 50 MA at 1.01...trust me, we DO NOT need to look further down ;-)
(there's also the Fibonacci lines to look at for support)
Orko Silver Weekly Chart
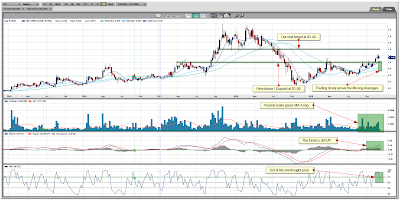
Chart is courtesy of marketclub.
Marketclub - Orko Silver Corp. Trend Analysis (What's this?)
Weekly! Anyone see that darn wizard Merlin running around on these charts? Hm? Oh well, magical nonetheless.
As you can see from the chart, it has not been that long since Orko Silver was trading above the center line again on the MACD chart...meaning UP TREND.
So, since September we again have after a long and for most holders a tedious time, Orko Silver is back on its up trend.
 The resistance at $1.00 is behind us and will from now on hopefully go through life with a new name,...namely...support! For my spiritually minded readers, Orko Silver broke the resistance, the resistance however was not counting on a speeding 1,000,000 pounds Silver train and sadly passed away only to reincarnate thereafter into support.
It is a cycle like any other.
So, next target I'm looking at is definitely the 1.40. This will probably not be broken in one try. When we get to that time frame this will show on the chart and when we cross that bridge I will long have posted another chart.
So, long term outlook still very good.

Chart is courtesy of marketclub.
Marketclub - Orko Silver Corp. Trend Analysis
(What's this?) Last time I did another article, Orko Silver was still on its breakout to its new recent high of 1.25. Since 1.20 was my initial target I'll settle for 1.25. From the MACD you could already see the divergence decreasing these last days and on the 7th of December Orko opened at 1.13 which was below the 10 Moving Average.
Not all that strange considering current events, gold and silver correcting, the dollar experiencing a little Frankenstein moment which will have its effect on the stock market. But not withstanding those events, Orko Silver has kept a steady pace finding support at the 61.8% Fibonacci Retracement.
Short term I see a bearish MACD crossover on the chart. It will remain to be seen whether we will go sideways from here or whether we break the support we seem to have around 1.14? That all depends on how far a correction we will get in gold and silver I suppose.
Till now Orko has kept up quite well if not beyond expectation!

Only one reason for that my opinion then...lots of backing and lots of support for Orko Silver from the market. Whether amongst investors or amongst fund managers. Orko Silver is not easily cast away like some other stocks. With this I mean, if push comes to shove and certain funds need to be freed, Orko Silver will probably come last on that list rather than first.
What also leads me to this rather bold statement? Well,..
- Because I am the writer and that is what I do, to boldly go where no man has gone before
- VOLUME
- Management
Support from the 30 MA at 1.06, the 50 MA at 1.01...trust me, we DO NOT need to look further down ;-)
(there's also the Fibonacci lines to look at for support)
Orko Silver Weekly Chart

Chart is courtesy of marketclub.
Marketclub - Orko Silver Corp. Trend Analysis
(What's this?) Weekly! Anyone see that darn wizard Merlin running around on these charts? Hm? Oh well, magical nonetheless.
As you can see from the chart, it has not been that long since Orko Silver was trading above the center line again on the MACD chart...meaning UP TREND.
So, since September we again have after a long and for most holders a tedious time, Orko Silver is back on its up trend.
 The resistance at $1.00 is behind us and will from now on hopefully go through life with a new name,...namely...support! For my spiritually minded readers, Orko Silver broke the resistance, the resistance however was not counting on a speeding 1,000,000 pounds Silver train and sadly passed away only to reincarnate thereafter into support.
 It is a cycle like any other.
So, next target I'm looking at is definitely the 1.40. This will probably not be broken in one try. When we get to that time frame this will show on the chart and when we cross that bridge I will long have posted another chart.
So, long term outlook still very good.
YeOldGoldNugget's links of interest

- New Video: Let’s Take a Fresh Look at Crude Oil
- New Video: Key Levels to Watch in the S&P 500
- New Video: The gold market continues to steam roll ahead!
- New Video: A look at the dollar index
- New Video: What do supertraders have in common
- New Video: Two Major Forces Collide in the Index Markets
- New Video: What’s Gold’s Next Stop?
- New Video: How long will Dow stay Bullish?
- New Video: Has Gold Topped Out for the Year?
- Has the S&P Index Topped Out for the Year?
- CRB Index insight video
- Are You Laughing or Crying About Markets?
- Introducing the Perfect Portfolio
- What does winter hold for Crude Oil?
- Free Email Trading Course Copy
- New Video: ETF GLD is analyzed


![Live 24 hours silver chart [ Kitco Inc. ]](https://lh3.googleusercontent.com/blogger_img_proxy/AEn0k_uWeGcmJLZ5zuWoAWmYEzWaWtlD9Eb2vLaO5SAD0piQ1sw2Bk81SyuJQBSdmCRSTuuShrXV6m068ccALvES_BUF4pkfIFxdFTS94G5Dw3E=s0-d)


.png)


