 Let me start off this article by introducing to you, Clint Eastwood as Blondie. The Good, a.k.a. the Man with No Name, a subdued, cocksure bounty hunter who competes with Tuco (The Ugly) and Angel Eyes (The Bad) to find the buried gold.
Blondie and Tuco have an ambivalent partnership. Tuco knows the name of the cemetery where the gold is hidden, but Blondie knows the name of the grave where it is buried, forcing them to work together to find the treasure. In spite of this greedy quest, Blondie's pity for the dying soldiers in the chaotic carnage of the War is evident. "I've never seen so many men wasted so badly," he laments.
Coincidentally in my story to drive the point home, Blondie aka The Good is represented by the HUI Index and the Gold Spot charts while Tuco aka The Ugly is represented by the Dollar. Blondie and Gold...that can't be a coincidence. Gold vs The Dollar. Anyway, beneath each chart I will try to explain why I believe the chart belongs in either The Good, The Bad 'or' The Ugly.
The Good
HUI Index Daily Chart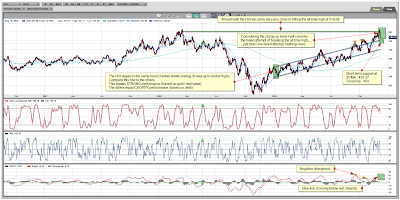
Chart is courtesy of marketclub.
Marketclub - HUI Index Trend Analysis
Gold Spot Daily Chart
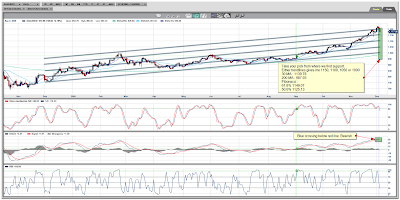
Chart is courtesy of marketclub.
Marketclub - Gold Spot Trend Analysis
Why classified under The Good? Just take a look at the HUI Index chart, take a look at the steady rise never failing to break from beyond its original trend channel from where it started early on in January 2009. Not only that, this week we came $2 dollars short of reaching the all time high. I'd say that qualifies as strong performance. The failing to break the all time high is like I said, just that, stocks don't have to break all time highs in one straight move. Maybe one, two or three attempts.
At least that index managed to get back to earlier highs.
Now on to gold...do the terms 'historic gains' mean anything? I don't really mind the little bumps or a possible correction, what must be done must be done. Like with the HUI, this will just be a correction, not the start of golds downward march to 984.
The Bad
S&P Daily Chart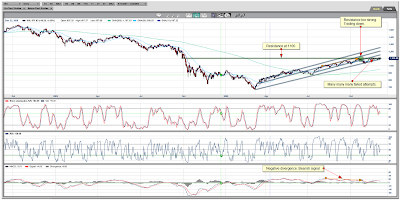
Chart is courtesy of marketclub.
Marketclub - S&P Index Trend Analysis
Nasdaq Daily Chart
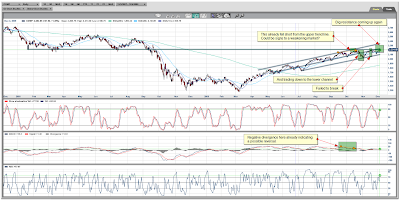
Chart is courtesy of marketclub.
Marketclub - Nasdaq Trend Analysis
Dow Jones Daily Chart

Chart is courtesy of marketclub.
Marketclub - Dow Jones Index Trend Analysis
So, The Bad! What do these charts have in common? They all to me at least, show choppy performance, failing to reach earlier highs is one. Second is, they are all showing signs of a market in disarray. A market in doubt. Will it go higher or will it go down? A market that is tiptoeing along...every leaf, twig or little pebble will set off the noise and release the evil bloodhounds...leaving everybody running for the exits...so to speak.
 Methinks, the debt package and stimulus money is running out...nothing like an inflated job report to try to stave off any possible drop. However, there is more needed than an inflated job report to continue this path.
I'm not convinced. I'd be careful, that's all. The Dow Jones even has a rising wedge in there which if confirmed does not bode well.
The Ugly
US Dollar Daily Chart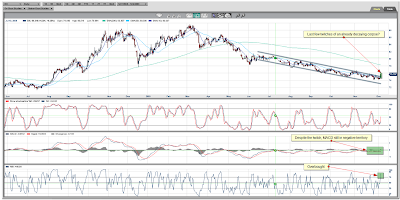
Chart is courtesy of marketclub.
Marketclub - US Dollar Trend Analysis
On to the almighty Dollar, the greenback, the world-currency, the safe-haven,...at least, that is what it once was known as.
 Almighty? NOT compared to what I can see from other currencies!
Greenback? Last time I checked they were still green.
World-currency? NOT for long!
Safe-Haven? NOT what I can see from gold's chart.
Summary
Now, I'm not per definition saying the markets are going down but I'm just stating and showing you what is on the charts. If they break those resistances then fine, none the wiser and we move on. However, if there does seem to be a reversal going on, then people and investors will, like they did before, take the money off the table. Will that money then go to the dollar or the treasuries...or will that money flow into gold, silver and the commodities?We all know who came out on top in the movie,...don't we?
YeOldGoldNugget's links of interest
- New Video: Let’s Take a Fresh Look at Crude Oil
- New Video: Key Levels to Watch in the S&P 500
- New Video: The gold market continues to steam roll ahead!
- New Video: A look at the dollar index
- New Video: What do supertraders have in common
- New Video: Two Major Forces Collide in the Index Markets
- New Video: What’s Gold’s Next Stop?
- New Video: How long will Dow stay Bullish?
- New Video: Has Gold Topped Out for the Year?
- Has the S&P Index Topped Out for the Year?
- CRB Index insight video
- Are You Laughing or Crying About Markets?
- Introducing the Perfect Portfolio
- What does winter hold for Crude Oil?
- Free Email Trading Course Copy
- New Video: ETF GLD is analyzed


![Live 24 hours silver chart [ Kitco Inc. ]](http://www.kitco.com/images/live/silver.gif)


.png)








No comments:
Post a Comment
Make new friends but keep the old ones, one is silver and the other is gold.
Although gold and silver are not by nature money, money is by nature gold and silver.
With those quotes, YeOldGoldNugget invites you to post a comment.