Buy gold online - quickly, safely and at low prices
Showing posts with label Fibonacci. Show all posts

Monday, December 21, 2009

Gold Heading to $1050?

Gold Spot Daily Chart
Gold Spot Daily Chart December 21, 2009
Chart is courtesy of marketclub.
Marketclub - Gold Spot Trend Analysis Marketclub - Gold Spot Trend Analysis (What's this?)

As of writing gold is already trading at $1088.35. It would seem and judging from the ADX indicator that the force of downward moves is increasing which means we could be looking further downwards.

Our 10 Moving Average is already a long way away at $1118 so daily and weekly we have run out of our closest supports.

As you see I've thus drawn a support at $1050. However, that is the first lowest level I'm looking at. There could be supports in between.

Gold Spot 5-Day Chart
Gold Spot 5-Day Chart December 21, 2009
Chart is courtesy of marketclub.
Marketclub - Gold Spot Trend Analysis Marketclub - Gold Spot Trend Analysis (What's this?)

From the 5-Day chart we see that the level around $1095 was taken out so another indicator which tells me we should look for a lower support.

So, what support remains there besides the $1050? Well, I've added two Fibonacci charts, one which has as start the latest rally which started late October and one which covers the entire rally from the beginning of September.

So, take your pick I'd say. Normally, when a stock retraces, traders look for a bounce from either the 61.8% or the 50.0% Fibonacci Retracement lines. So, only supports left would be found on the complete Fibonacci chart.

Gold Spot Daily Fibonacci Retracements
Gold Spot Daily Fibonacci Retracements Late October - December
Gold Spot Daily Fibonacci Retracements September - December
Charts courtesy of marketclub.
Marketclub - Gold Spot Trend Analysis Marketclub - Gold Spot Trend Analysis (What's this?)

Just know that daily and thus short term, the downside has again increased so take care with those long positions. Gold is not correcting on the rally from late October but it is correcting on the entire rally which started early September so $1050 would indeed be a great target.

Gold Spot Weekly Chart
Gold Spot Weekly Chart December 21, 2009
Chart is courtesy of marketclub.
Marketclub - Gold Spot Trend Analysis Marketclub - Gold Spot Trend Analysis (What's this?)

On the weekly, the UP trend is still confirmed by the MACD, the ADX and the strong performance gold has had.

Not much more I can say here. I need to see the market perform after this day before I can second guess any further. One thing to watch is of course the dollar! I have absolutely NO frickin' idea on what basis this thing is rallying but it probably will have some very vague reason??? If anyone knows please enlighten me.

Jim Rogers has the following to say :


YeOldGoldNugget's links of interest

Tuesday, December 8, 2009

Orko Silver Chart December 08, 2009

Orko Silver Daily Chart
Orko Silver Chart December 08, 2009
Chart is courtesy of marketclub.
Marketclub - Orko Silver Corp. Trend Analysis Marketclub - Orko Silver Corp. Trend Analysis (What's this?)

Last time I did another article, Orko Silver was still on its breakout to its new recent high of 1.25. Since 1.20 was my initial target I'll settle for 1.25. From the MACD you could already see the divergence decreasing these last days and on the 7th of December Orko opened at 1.13 which was below the 10 Moving Average.

Not all that strange considering current events, gold and silver correcting, the dollar experiencing a little Frankenstein moment which will have its effect on the stock market. But not withstanding those events, Orko Silver has kept a steady pace finding support at the 61.8% Fibonacci Retracement.

Short term I see a bearish MACD crossover on the chart. It will remain to be seen whether we will go sideways from here or whether we break the support we seem to have around 1.14? That all depends on how far a correction we will get in gold and silver I suppose.

Till now Orko has kept up quite well if not beyond expectation!

Orko Silver Corp - Developing One of the Worlds Largest Primary Silver Deposits
Only one reason for that my opinion then...lots of backing and lots of support for Orko Silver from the market. Whether amongst investors or amongst fund managers. Orko Silver is not easily cast away like some other stocks. With this I mean, if push comes to shove and certain funds need to be freed, Orko Silver will probably come last on that list rather than first.

What also leads me to this rather bold statement? Well,..
  1. Because I am the writer and that is what I do, to boldly go where no man has gone before
  2. VOLUME
  3. Management
The first one I think needs no explanation, the second one, well, just look right and then look left, nuff said about that and last but not least, management...well, you gotta hand it too them, they got the goods and they WILL deliver. My 2 goldnuggets.

Support from the 30 MA at 1.06, the 50 MA at 1.01...trust me, we DO NOT need to look further down ;-)
(there's also the Fibonacci lines to look at for support)

Orko Silver Weekly Chart
Orko Silver Chart December 08, 2009
Chart is courtesy of marketclub.
Marketclub - Orko Silver Corp. Trend Analysis Marketclub - Orko Silver Corp. Trend Analysis (What's this?)

Weekly! Anyone see that darn wizard Merlin running around on these charts? Hm? Oh well, magical nonetheless.

As you can see from the chart, it has not been that long since Orko Silver was trading above the center line again on the MACD chart...meaning UP TREND.
So, since September we again have after a long and for most holders a tedious time, Orko Silver is back on its up trend.

Pan American Silver Bar - Copyright © 2009 Northwest Territorial MintThe resistance at $1.00 is behind us and will from now on hopefully go through life with a new name,...namely...support! For my spiritually minded readers, Orko Silver broke the resistance, the resistance however was not counting on a speeding 1,000,000 pounds Silver train and sadly passed away only to reincarnate thereafter into support.

It is a cycle like any other.

So, next target I'm looking at is definitely the 1.40. This will probably not be broken in one try. When we get to that time frame this will show on the chart and when we cross that bridge I will long have posted another chart.

So, long term outlook still very good.


YeOldGoldNugget's links of interest

Tuesday, November 24, 2009

Orko Silver Chart November 24, 2009

Orko Silver Daily Chart
Orko Silver Chart November 24, 2009
Chart is courtesy of marketclub.
Marketclub - Orko Silver Corp. Trend Analysis Marketclub - Orko Silver Corp. Trend Analysis (What's this?)

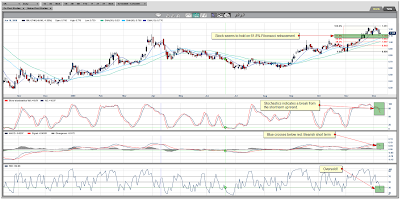
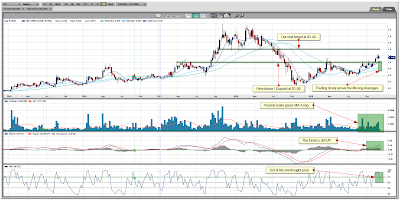
The daily chart now shows in clearer detail the breakout which happened on November the 16th. If you take a look at the volume chart you'll see that volume has been steadily building up since the start of this rally November the 10th. On and off we've seen 353K, 402K, 545K and 732K shares being traded with the larger volumes being seen since breaking resistance at 1.00 at November the 16th.

When I take a look at the Moving Average Convergence Divergence (MACD) you can see we've had the bullish crossover a couple of trading days ago and we are still up-trending. There is as of yet no sign of any reversal showing up on the daily. (Divergence still positive)

Relative Strength Indicator (RSI) is now just about getting back at the start of being overbought. I say, at the start cause even on the daily chart Orko as we can see from the rally from early September, Orko can stay in the overbought zone for a prolonged time. We are now only a couple days in overbought so still nothing to worry about as far as I'm concerned.

Orko Silver Corp - Developing one of the world's largest Silver deposits
Trading action today again very solid. To most it will seem just like 200K shares traded but take a look at the orders which weren't filled so today again very solid action.

Most juniors were trading down and Orko was trading up and managed to close at 1.18+0.04 (3.51%). All in all still very pleased with the action going on in Orko. What does one need more, this has it all for the short-term trader AND for the long-term trader. For a short-term trader, just take a look at the chart, buy early September, get out September 25, get in early October, get out late October,...

Orko Silver Weekly Chart
Orko Silver Chart November 24, 2009 (Weekly)
Chart is courtesy of marketclub.
Marketclub - Orko Silver Corp. Trend Analysis Marketclub - Orko Silver Corp. Trend Analysis (What's this?)

On to the weekly where we try to spot the expected longer term trend. From the weekly you'll see on the MACD chart that we are only since the start of October trending above the MACD center line. That fact and the fact that we are trading above all Moving Averages bodes well for Orko long term.

Also from the chart you can see the resistance line I've drawn at 1.00 and the bottom at around 0.80. The 1.00 seems pretty clear to me. The 0.80 is found by looking at the 200 MA, you'll see that from the start of the big drop from April 2008 to about September 2008, there is some sideways action going on around 0.80. Besides this, getting under 0.80 there would mean going under the 200 MA. The 0.80 has acted as support and resistance before.

Placing some Fibonacci retracement lines on the chart from our high of about 2.00 and our low of 0.28 gives us 1.14 as another key point as this coincides with the 50% Fibonacci. Fibonacci wise our next target should be 1.34.

Would be a very hard feat for YeOldGoldNugget to describe these charts as being bearish in nature if not near impossible.

This Bull has HornsNope, this bull has horns and some very nice ones mind you. Should be clear to individuals, funds and computer programs that Orko is trading up from here. With Pan American Silver again stating very clearly to have a production decision ready on La Preciosa by the end of 2010 I do not think I need to draw a little picture for visual purposes as to where this thing is going to go...do I?

I think most can do their own maths on that. Here's a little blast from the past and from when I just started up my blog on Orko. Doesn't the low seventies sound cheap now? Back then it probably wasn't to most. That is why it is so important to do your own due diligence, find a stock which you like, with decent management, approachable to shareholders, valid track record, good project(s), plenty of funding, interest from junior/senior...AND STICK WITH IT!

That would be my advice anyway as a long term holder. For the surfers amongst us, please ride the long waves only, don't bet against our precious Orko by going short. That is bad JuJu! The market will punish you for it I'm sure.

I think that's about all I have to say for the moment about Orko. One more thing though, I was going to do a gold chart but time is short so this will have to wait till tomorrow. Only two things I have to say right now, never a bad idea to take some profits off the table and also never to go against the trend. Though I recognize the overbought and the big rally without correction I still find it extremely dangerous betting against this rally. More on that tomorrow.


YeOldGoldNugget's links of interest

Tuesday, November 3, 2009

Orko Silver Chart November 03, 2009


Silver train is a comin',
think I'm gonna get on now, oh, yeah.
Silver train is a comin',
think I wanna get on now, oh, yeah, oh, yeah.
Silver rain is a fallin',
fallin' up around my house, oh, yeah,
silver rain is a fallin', fallin' up around my house, oh, yeah, oh, yeah.

And I did not know her name, and I did not know here name,
but I sure love the way that she laughed and took my money.
And I did not know here name, and I did not know her name,
but I sure loved the way that she laughed and called me Honey.

Any chance Orko Silver Corp was around in '73?

Mick's right about wanting to get on though! Never mind about the money taking part, that is just for the ticket, at the end of the ride you will be well reimbursed.

Orko Silver Daily Chart
Orko Silver Daily Chart November 03, 2009
Chart is courtesy of marketclub.
Marketclub - Orko Silver Corp. Trend Analysis.

Orko Silver Level 2 Quotes - Hotstocked.comAm I allowed to be excited? What a day! Now I had decided for myself to wait for a breakout before doing another chart on Orko Silver. Not much sense doing a chart if certain conditions have not been met,...right?

But today, they were met and more then so!

However, lets rewind to that very moment when everybody was still busy cleaning the puss out of their eyes. Orko Silver Corp was already looking at a lower opening of 0.86. What a bummer I thought. Another hour passed and we were already looking at 0.85 on the boards. Couldn't get any better.

But then, suddenly around 10:10 am I noticed gold steadily increasing and after just a few moments we were already trading around 1079 ;-)
The action was too strong, something had to have happened. Turned out later that India was buying IMF gold

Well, as of that moment all bets were off.

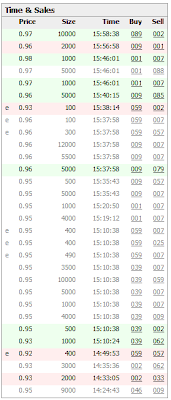
As of 11:00 am Orko Silver was on a rise and destined to break 1.00. The rise today was on pretty decent volume and with some good bids around 0.95.

Looking at the chart, all indicators are bullish. I could not find one thing to award a red minus on the chart, not a single thing! Only green green green, I also checked the weekly chart of course. We have an MACD which could do a bullish crossover anytime, stochastics and RSI are again showing significant upside potential and we could move a bit higher now before reaching overbought again.

There is still the possibility of the market reacting to the cup and handle depending on what volume we get when breaking the 1.04. If momentum is good, expect everyone to jump on board, it is a self-fulfilling prophecy and thus a bullish scenario.

We are in November now, so that means that either this or next week we could be expecting the long awaited news release in our mailbox. That could provide us with enough sparks to validate and enforce the Cup and Handle. This is me hoping, hope you understand that...as I always say, always reach for the stars and touch the sky.

Orko Silver surged over 12% today and closed at 0.97 +0.100 (11.49%)

Oh, about the chart, you'll see that I have already taken a new Fibonacci low to draw my retracements, that means I'm now looking at the 0.81 as our new low. Going back and using the August low as start point of my Fibonacci Retracement invalidates last Octobers rally....and that would not be correct. In October we rallied to 1.04 and now we are retracing from that rally. That is how you have to see it.

Fibonacci wise the stock price shows some strong action, breaking all Fibonacci levels and thus from that I would be looking at Orko Silver making a break for the 100% Fibonacci level and thus a break of 1.04, either tomorrow or the next days. Depending upon the actions of gold and silver of course.

Train - amazing-animations.comchoo choo!!


YeOldGoldNugget's links of interest

Thursday, October 29, 2009

Orko Silver Chart October 29, 2009

Orko Silver Daily Chart
Orko Silver Chart October 29, 2009
Chart is courtesy of marketclub.
Marketclub - Orko Silver Corp. Trend Analysis.

A lot of highlights on my chart as you will notice. I will try to explain cause there is an order in them. They start at the left following each candle and explanation. Here it goes, for those who remember my October the 5th article I did in which I made it quite clear as to where I thought we stood and what one should do at that moment. Well, that October the 5th was actually the start of the rally in gold reaching 1070.

It was thus also the start of the rally for Orko Silver and at that very point in time is where my 0.0% Fibonacci line begins. Exactly at the low of that very day which was about 0.816. The rally lasted until October 14, you can spot it on the last chart as it was the first red candle (hammer) after a long series of blue (green) candles.

That gave us the high of the rally and with that our 100.0% Fibonacci line. In our case this is 1.041. Those are the numbers, the rest falls into place as retracement levels. One normally draws a Fibonacci chart like in this case, after an uptrend has occurred and one needs to find out if a pullback occurs, at which levels there could be support.

You can see from the chart that after the rally the pullback was until the 50.0% Fibonacci line and that level held for 4 days when on day 5 we got the false breakout to the 61.8% retracement level. A sucker's rally is what it turned out to be, looking at in hindsight.

Pan American Silver Bar - 2009 Copyright Northwest Territorial MintAfter the false breakout, what actually was the breakdown in gold and silver we got our downward march. Luckily for us, the shakeout in gold came to a standstill and on our chart that perfectly coincides with the 23.6% Fibonacci level.
And as of this moment we are already heading back up.

So chart wise I'd like to see another up day tomorrow and a close above 0.95 which is a clear break of the 61.8% Fibonacci level but also puts us above the 10 MA line.
If that happens, all lights are green for the Orko Silver speed train to blast through 1.00 and beyond.

The momentum is definitely there, we had some decent volume being traded which was around 370K. Chart looks good again. Gold and silver look good to go again, the headlines making the news on Wall street were Stocks Rally Sharply On 3Q Gross Domestic Product.

Allow me to translate that one for my readers, I do provide media translation assistance, for a minor fee I will even come to your home and will translate directly all the news stories you are watching on your television station.

So, when it reads, Stocks Rally Sharply On 3Q Gross Domestic Product, that means,...

Pack your bags cause we are heading south again in Dollar-ville

So, on with Orko I have some latest news, some will already be aware of this but I wanted to make contact with management and have it verified before I posted it online.

In discussion with IR :
  • within 2 to 3 weeks we should get a couple of news releases regarding infill drilling, metallurgical testing and probably exploration drilling, starting next week with news on the infill drilling
  • Ben and Gary in Mexico, returning end of next week
  • George and Mike on their way back from South-Africa , returning early next week
  • PAAS investing in infrastructure, roads, offices, power generator ,... at La Preciosa
There was also mention of results coming in the coming days or beginning of November. The time frame could very well be true but the nature of how good the results would be are however not verified. It is my belief that they will be good but that is just my opinion, I also heard from another contact that the metallurgical recovery rate could go up but again that is unconfirmed. We will have to wait and see what the news release will bring.

Gold Spot Daily Chart
Chart is courtesy of marketclub.
Marketclub - Gold Spot Trend Analysis.

Gold Spot Kitco.com
Chart is courtesy of Kitco.com

You can clearly see that yesterday, Wednesday October 28 at around 16:00 we made what looks like our first bottom at around 1026. From there on some slow but steady progress, until next morning that is because after only 25 minutes into opening at the New York Nymex there were some strong buyers lifting the price from 1032 to over 1037 and a little while later we were already trading at 1046.

Johnson Matthey 1 Kilo Gold Bars - Image ©2005-2009 Northwest Territorial MintYou can see from Kitco's 3 day comparison chart and my chart that indeed getting over 1042 was needed to give this rally any sort of significance. Now that we have indeed broke our 3-day low, this now adds to the strength of our rally. It could have been different. Gold could have rallied to 1042 and we could have seen doubt or fear again. We didn't! Gold kept going and beat its 3-day low and is now looking to head back up the 10 MA line. That's not the line on the chart I've posted, it can only be seen on the daily chart.

That means that gold should head back up to 1055 and beyond. To keep it simple, on the daily chart all things that need to point up are pointing up so therefore I am looking first at getting to 1055. If that not only holds but has no problem going higher than it would be fair to assume that getting to AND over 1070 will not be all that far of a stretch.

Gold Spot Daily Chart Update
Gold Spot Daily Chart
Chart is courtesy of marketclub.
Marketclub - Gold Spot Trend Analysis.

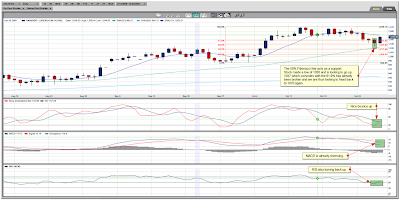
I've now posted the daily chart to put things into perspective. From today's action you can see we seem to have bounced back up from the 50.0% retracement level. The 0.0% Fibonacci I use here coincides with the low we made late September before we rallied to 1070 (100%). Getting to and above 1050 would bring us back above the 10 MA line.

You can see that were we are at right now 1046, that this is above the 61.8%. Only thing that remains is the last little hurdle before we hit 1070 again.

YeOldGoldNugget's links of interest
Buy gold online - quickly, safely and at low prices

Wednesday, October 28, 2009

Orko Silver Chart October 28, 2009

Orko Silver Daily Chart
Orko Silver Chart October 28, 2009
Chart is courtesy of marketclub.
Marketclub - Orko Silver Corp. Trend Analysis.

A quick update after a couple hours into trading. The downward force on the commodities markets is getting too strong for Orko Silver to bear. The 0.90 support has broken and we are looking for support of the 50 MA line around 0.85. If that doesn't hold this stock will go down to around 0.81 before we will see selling pressure decline and buying increase.

Like I said yesterday, we will see 1020 in gold and 16.00 in silver before we will see renewed interest.

Orko Silver Daily Chart Update
Orko Silver Chart October 28, 2009
Chart is courtesy of marketclub.
Marketclub - Orko Silver Corp. Trend Analysis.

My earlier chart has an error on it. The Fibonacci Retracement lines should be drawn like on the updated chart. The 0.90 was a support but in my updated chart this coincides with the 38.2% Retracement level. The top should coincide with the 100% level and the bottom and thus, the start of the uptrend, should coincide with the 0% Fibonacci Retracement level. We are now retracing from an earlier uptrend.

2009 Copyright Northwest Territorial Mint - 100oz BarAs you can see from the chart we are now hovering at 0.87 which coincides with the 23.6% Retracement level. Normally, when a stock has had an uptrend and we get a pullback, traders look at a bounce back up from either the 61.8% or 50% level. Now, since we have already broken through those levels it is unlikely the 23.6% Retracement level will act as a support. Only thing that will add a bit of support around the level where we are now is the 50 MA line which coincides with somewhere around 0.85.

If tomorrow the 16.00 for silver holds then Orko Silver will hold around 0.85 and 0.87, if it not only holds but we get a bounce up for silver then most everyone will decide the bottom has been set and will start buying again and we might get a close in the green. That would be the optimistic picture which I'm holding on to for now.

Google Finance Sector Summary Chart
Chart is courtesy of Google Finance

Some heavy losses across the board and the commodities markets are bearing the brunt of taking the biggest losses inflicted today.

Gold Spot Daily Chart
Chart is courtesy of marketclub.
Marketclub - Gold Spot Trend Analysis.

Gold BarAs you can see from the gold chart I posted. There is the potential for an even bigger drop, that is if the 1017 or 1020 supports don't hold. Just as you know, it is not out of the ordinary for gold to make such a correction before heading further up. The RSI and stochastics are indicating we are at or very near oversold levels so a possible reversal could be soon knocking at the door.

Just pray or whatever one does, rub your gold coin, that the 1017 and 1020 hold cause if they don't better make sure to get some money on the sides cause it will be bargain shopping time again across the junior markets. For the day-traders, get out there where you have enough profits and get in where prices are cheap and fundamentals are strong.

Don't take losses easily, do so only after the fundamentals of the company you are invested in have changed for the worse.


YeOldGoldNugget's links of interest

Wednesday, October 21, 2009

Orko Silver Chart October 21, 2009

Orko Silver Daily Chart
Orko Silver Chart October 21, 2009
Chart is courtesy of marketclub.
Marketclub - Orko Silver Corp. Trend Analysis.

I'm really sorry, I don't have that much time to do a real detailed chart today. I just took a bit longer working on my Fed Black Book article and unlike the office guy in the other article I am worth every penny they pay me so I really should go to bed so today is going to be a quick one then.

As you can see from the chart, today definitely qualifies as a breakout from our downward going and tight-held pattern. Chartwise that is. I still need the share price to make a run for the 100% Fibonacci line which of course corresponds with the 1.04 from a little while ago. When you draw Fibonacci lines you in this case have to start with the low of the earlier upward march to the latest high.

I am however very confident that that will happen. Why?

Today the US dollar broke support around 75.21 and went as low as 75.00 and the way from 75.21 to 72.00 is all open now. It is only a matter of time now before we get the 72.00 on the boards. Now its no more a matter of if but rather of when?

So today, Orko closing at 0.980 +0.040 (4.26%) was very welcome and tomorrow we should see a continuation of today's action however preferably with some added volumes.

US Dollar Chart October 21,2009
US Dollar Chart

Can anyone say battlefield!

Johnson Matthey 1-Kilo Gold BarsThat the dollar broke support should sound like music to those who have golden or silver ears. I'd say the second kick-off event has started October 21st!

On to 1100 and higher for gold is all I can say about that and that goes the same for silver which should make and do a break of 18.00 in the coming weeks ahead. I'd sure like to see the forces joining hands to drive the dollar breaking support from investors minds around this globe.

As I'm writing this gold has already reached 1060 again and looks like it will easily reach 1065 by midnight.


YeOldGoldNugget's links of interest

Saturday, October 3, 2009

Orko Silver Chart October 02, 2009

Well yesterday was not as bad as the day before but still bad enough for the broader market. US job losses unexpectedly accelerated last month and the unemployment rate reached the highest level since 1983, signaling any recovery in consumer spending and economic growth will be slow to develop.

Well, those were the headlines anyway which started the sell off and when you have unemployment soaring to those levels then what viable economic recovery is there actually is what investors think? My views are a little different then some since I do not have to wait for a report like that to know that the figuratively speaking manure has already hit the fan and has already ricochet off it and on basically all who have a bank account and take part in our current financial system.

You see that leaves me looking not at the markets but at investor sentiment. That's even harder to do. Me, I'm already aware that no matter what the news may say about recession over, investor sentiment up and all, this recession is far from over and investor sentiment is not 'really' up. What kind of polls can claim investor sentiment is up and with the smallest event have them running for the exits so to speak.

Rose colored glassesCan anyone really blame them after last time? So no, I definitely can't, that's just the media and their rose colored view creating the perception that investor sentiment is up and we're getting out of this recession while us contrarians know its not and leaves us at the behest of events like these.

Know this though:

In times like these Gold and Silver are and have always been the safest investment. Since ancient times until our technological and digital age. Will our age be different? Me thinks not!

Gold and silver held up pretty well after AGAIN being beaten down at the start of comex trading in New York but surprisingly they immediately surged higher (writer learns later that this is due to actions of the White Knight *) and in no time regained all the previous losses. Gold and silver went a bit sideways after that but this kept gold again neatly at the 4 digit mark of 1000$.

Someone doesn't want this gold price to drop too far under the 1000 mark that's for sure! Does someone think this is also mainly due to China? That shouldn't have to be the only reason, there are probably hundreds of reasons to write down why gold has held its bearings so well. The China aspect is in my opinion one of the major reasons.

Daily Chart
Orko Silver Chart October 02, 2009
Chart is courtesy of marketclub.
Marketclub - Orko Silver Corp. Trend Analysis.

So, to the chart of the day...Orko Silver opened at 0.85 which is yet another Canadian cent lower than Thursday. At 10:30 AM we already had our low of 0.82 on the boards. We did however see some action in the afternoon which looked like we were going to end in the green for the day but due to some late selling the stock managed to end lower and close in the red at 0.83 -0.010 (-1.19%).

So to me as someone who watches the stock daily,...the interest is there for this to go higher. That's a fact...in my opinion then cause there's only one person doing the writing here ;-)
Sadly October already being a tough month for stocks and the gloomy report about the more than expected job losses brought everything down including stocks who were meant to go up.

So that means we are now looking at a possible new target of 0.80 to look for renewed interest or a possible bottom. Also one more thing investors have to consider, will this year be different than last year? Will the already hurt and still bloodied junior mining market again bear the brunt of last year's panic selling or will some of the money that will flow out of different sectors start flowing into gold and silver bullion and with that also the junior market?

Around 0.80 till 0.83 there was the start of the rally so that also plays a part to look for where this thing is going to bottom out. The 0.805 coincides with the 50% Fibonacci line which also could act as a bottom and a target for us to look at.

And to end this week's chart of the day I'd also like to provide my last statement for the week.

The moment for gold to break the all time high is getting ever nearer.

* Reference made by Ed Steer from Casey Research to the mysterious person or persons supporting the gold price after the bullion banks again tried to pull down gold and silver on Comex.


YeOldGoldNugget's links of interest

Wikinvest Wire


Watch INO TV for FREE now.

Orko Silver Corp. Chart


MarketClub Free Trial - Tools for the Trader

24 Hour Spot Silver (Bid)

Live 24 hours silver chart [ Kitco Inc. ]

Buy Gold Online - BullionVault

Buy gold online - quickly, safely and at low prices

Educational Videos - Market Analysis

Watch the latest educational videos from MarketClub by Adam Hewison