
Chart is courtesy of marketclub.
Marketclub - Orko Silver Corp. Trend Analysis.
A quick update after a couple hours into trading. The downward force on the commodities markets is getting too strong for Orko Silver to bear. The 0.90 support has broken and we are looking for support of the 50 MA line around 0.85. If that doesn't hold this stock will go down to around 0.81 before we will see selling pressure decline and buying increase.
Like I said yesterday, we will see 1020 in gold and 16.00 in silver before we will see renewed interest.
Orko Silver Daily Chart Update
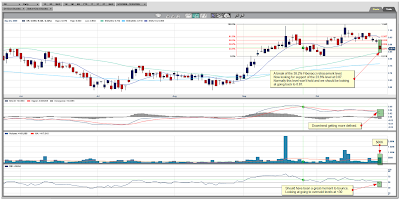
Chart is courtesy of marketclub.
Marketclub - Orko Silver Corp. Trend Analysis.
My earlier chart has an error on it. The Fibonacci Retracement lines should be drawn like on the updated chart. The 0.90 was a support but in my updated chart this coincides with the 38.2% Retracement level. The top should coincide with the 100% level and the bottom and thus, the start of the uptrend, should coincide with the 0% Fibonacci Retracement level. We are now retracing from an earlier uptrend.
 As you can see from the chart we are now hovering at 0.87 which coincides with the 23.6% Retracement level. Normally, when a stock has had an uptrend and we get a pullback, traders look at a bounce back up from either the 61.8% or 50% level. Now, since we have already broken through those levels it is unlikely the 23.6% Retracement level will act as a support. Only thing that will add a bit of support around the level where we are now is the 50 MA line which coincides with somewhere around 0.85.
If tomorrow the 16.00 for silver holds then Orko Silver will hold around 0.85 and 0.87, if it not only holds but we get a bounce up for silver then most everyone will decide the bottom has been set and will start buying again and we might get a close in the green. That would be the optimistic picture which I'm holding on to for now.
Google Finance Sector Summary Chart

Chart is courtesy of Google Finance
Some heavy losses across the board and the commodities markets are bearing the brunt of taking the biggest losses inflicted today.
Gold Spot Daily Chart

Chart is courtesy of marketclub.
Marketclub - Gold Spot Trend Analysis.
 As you can see from the gold chart I posted. There is the potential for an even bigger drop, that is if the 1017 or 1020 supports don't hold. Just as you know, it is not out of the ordinary for gold to make such a correction before heading further up. The RSI and stochastics are indicating we are at or very near oversold levels so a possible reversal could be soon knocking at the door.
Just pray or whatever one does, rub your gold coin, that the 1017 and 1020 hold cause if they don't better make sure to get some money on the sides cause it will be bargain shopping time again across the junior markets. For the day-traders, get out there where you have enough profits and get in where prices are cheap and fundamentals are strong.
Don't take losses easily, do so only after the fundamentals of the company you are invested in have changed for the worse.
YeOldGoldNugget's links of interest
- Has the Gold Market Topped Out?
- Has the S&P Index Topped Out for the Year?
- CRB Index insight video
- Are You Laughing or Crying About Markets?
- Introducing the Perfect Portfolio
- What does winter hold for Crude Oil?
- Free Email Trading Course Copy
- New Video: ETF GLD is analyzed


![Live 24 hours silver chart [ Kitco Inc. ]](http://www.kitco.com/images/live/silver.gif)


.png)


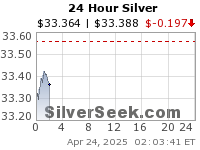






I see a reverse action in Silver going on. Bodes well...for now at least.
ReplyDeleteLets see if we survive the action between 12 and 2. If those hold then the Shining White Knight is back in the saddle.
Same goes for gold. If this keeps up..lets hope we survive noon and the trading hours thereafter.
ReplyDeleteLets all rub our gold nuggets together! Make some waves!