Buy gold online - quickly, safely and at low prices
Showing posts with label Support. Show all posts

Tuesday, December 22, 2009

Orko Silver's Strong Performance

Orko Silver still going strong.

Orko Silver Daily Chart
Orko Silver Daily Chart December 23, 2009
Chart is courtesy of marketclub.
Marketclub - Orko Silver Corp. Trend Analysis Marketclub - Orko Silver Corp. Trend Analysis (What's this?)

Well, not much has changed since I wrote up my last chart. Not for Orko Silver anyway which is still going strong despite a correcting gold and silver market. Just goes to show how a stock gets a reputation of being a strong performer. That title in my book at least is also bestowed on stocks that can witter any storm.

Just compare Orko Silver to most other stocks. Result. Orko holds, most others drop!

Besides that, just take a look at some of the profits one could have taken since Orko Silver started its up march. From early September trading around $0.60 and going to $0.90 up to November for a 50% gain. Then, from early November from $0.90 to around now $1.25 for another near 40% gain.

Also, just take a look at some of these volumes of the last couple of days :
  • December 16, 2009 Volume 875K
  • December 17, 2009 Volume 689K
  • December 21, 2009 Volume 447K
That is some very steady trading to put it mildly. I don't know why but I have the feeling that someone is loading up on shares around $1.20. If that is the case than when this party is done with their Christmas shopping then I expect we could see the start of another UP rally.

I think we have plenty of support at $1.00 and some additional support at $1.10. Anything below that is buying opportunity in my book and that is not saying that it still isn't cheap at $1.20...cause it is.

MACD or the Moving Average Convergence Divergence indicator is trending downwards but not with such strength so as to be concerned. I think this will bounce back up way before we hit the center line. This already shows in the histogram. As you see, the histogram is not increasing but remaining the same.

From the chart we can also see we are still trading above all Moving Averages, and above, well sorta cause we are right at the 10 MA which is around $1.20

So on the daily, I still do not see any considerable downside from here so therefor I must conclude that until said party is loaded up we will remain pricebound around these prices of $1.10 to $1.25.

Orko Silver Weekly Chart
Orko Silver Weekly Chart December 23, 2009
Chart is courtesy of marketclub.
Marketclub - Orko Silver Corp. Trend Analysis Marketclub - Orko Silver Corp. Trend Analysis (What's this?)

Weekly, still looking at a BULLISH chart. There is this small delay in Durango station we are experiencing but I reckon we are just loading up on passengers until the Silver Train is fully booked up and ready to go!

The rise in average volume can clearly be seen on the weekly chart. I've drawn a red arrow beneath the red line to visualize this. So, more and more shares are changing hands.

MACD is trending upwards and above the center line and thus our UP trend is still intact.

Orko Silver Weekly ADX Chart
Orko Silver Weekly ADX Chart December 23, 2009

I've also added the ADX chart. Again on the ADX, the Average Directional Index can determine trend strength regardless of the market direction. This non-directional oscillator is based on a range of 1 to 100 (although movements over 60 are rare). If the line is under the 20 mark, the trend is considered to be weak. If the line is above the 40 mark, the trend is considered to be strong. The ADX line is built on the results of two separate technical indicators, the +DI (force of up-moves) and the –DI (force of the down-moves). The default for this study is 14 periods which takes into the consideration the measurements of the +DI and –DI for the last 14 periods.

Knowing this and taking a look at Orko's ADX...clearly UP and the trend is qualifying for a STRONG rating.


YeOldGoldNugget's links of interest

Monday, December 21, 2009

Gold Heading to $1050?

Gold Spot Daily Chart
Gold Spot Daily Chart December 21, 2009
Chart is courtesy of marketclub.
Marketclub - Gold Spot Trend Analysis Marketclub - Gold Spot Trend Analysis (What's this?)

As of writing gold is already trading at $1088.35. It would seem and judging from the ADX indicator that the force of downward moves is increasing which means we could be looking further downwards.

Our 10 Moving Average is already a long way away at $1118 so daily and weekly we have run out of our closest supports.

As you see I've thus drawn a support at $1050. However, that is the first lowest level I'm looking at. There could be supports in between.

Gold Spot 5-Day Chart
Gold Spot 5-Day Chart December 21, 2009
Chart is courtesy of marketclub.
Marketclub - Gold Spot Trend Analysis Marketclub - Gold Spot Trend Analysis (What's this?)

From the 5-Day chart we see that the level around $1095 was taken out so another indicator which tells me we should look for a lower support.

So, what support remains there besides the $1050? Well, I've added two Fibonacci charts, one which has as start the latest rally which started late October and one which covers the entire rally from the beginning of September.

So, take your pick I'd say. Normally, when a stock retraces, traders look for a bounce from either the 61.8% or the 50.0% Fibonacci Retracement lines. So, only supports left would be found on the complete Fibonacci chart.

Gold Spot Daily Fibonacci Retracements
Gold Spot Daily Fibonacci Retracements Late October - December
Gold Spot Daily Fibonacci Retracements September - December
Charts courtesy of marketclub.
Marketclub - Gold Spot Trend Analysis Marketclub - Gold Spot Trend Analysis (What's this?)

Just know that daily and thus short term, the downside has again increased so take care with those long positions. Gold is not correcting on the rally from late October but it is correcting on the entire rally which started early September so $1050 would indeed be a great target.

Gold Spot Weekly Chart
Gold Spot Weekly Chart December 21, 2009
Chart is courtesy of marketclub.
Marketclub - Gold Spot Trend Analysis Marketclub - Gold Spot Trend Analysis (What's this?)

On the weekly, the UP trend is still confirmed by the MACD, the ADX and the strong performance gold has had.

Not much more I can say here. I need to see the market perform after this day before I can second guess any further. One thing to watch is of course the dollar! I have absolutely NO frickin' idea on what basis this thing is rallying but it probably will have some very vague reason??? If anyone knows please enlighten me.

Jim Rogers has the following to say :


YeOldGoldNugget's links of interest

Tuesday, December 15, 2009

Will Silver Bounce Back Before Christmas?

Silver Spot Daily Chart
Silver Spot Daily Chart December 15, 2009
Chart is courtesy of marketclub.
Marketclub - Silver Spot Trend Analysis Marketclub - Silver Spot Trend Analysis (What's this?)

I'm looking at the daily chart here, December the 15th on our 349th day of the year with only 16 more to go before we take silver into 2010.

Now, looking at the daily chart, I must honestly confess, I've seen better. Yes, at December the 11th we've hit a new 3 week low of $16.91. Yes, we have been trading down from our high of $19.45 which was put on the boards at December the 2nd and have traded down from then. Yes, we are trading below our Moving Averages.

However, to me, that only shows that we could be very near a turning point which does not mean I'm indicating a bottom here. Don't get me wrong, what I'm saying is, the market could find a bottom here. Like me, others look at the same charts and find the same lines, resistances, supports, pivot points, 8 year cycles, 12 year cycles,... And to me, unless I fail at drawing computer generated straight lines in a...well...straight line...then the chart is telling me we could indeed be at such a point.

So, when I say, NO, I'm not indicating a bottom, I'm also saying, either we go up from here or we break the trend line. So, that still leaves us both options.

Which do I favor or rather think more likely to happen from here?

Well, personally and chart wise I'd say we very well could go up from here. So my guess is there will surely be many investors who will take the figuratively speaking plunge into a silver long investment. When some do, that will cause a ripple and more will follow. It is the way of the market.

I'm already hearing about March 2010 silver prices going as high as $22.00. So, already the market is looking at way higher prices than what we are now looking at.

So,...is a $22.00 silver price in March 2010 realistic?

Well, the answer to that question would be...PRETTY MUCH YEA!

Like gold, silver CAN, HAS and WILL again in the near future perform like it seems there is nothing holding it back. Just take a look at the beginning of September when gold started moving away from the $1000 level, silver was trading at September the 1st with a low of $14.62 moving all the way up to September the 17th to finish off with a high of $17.65. At that very same time gold had only made a high of $1024.

Seasons Greetings Bar Silver - 2009 Copyright Northwest Territorial MintNow, I'm sure not all of my readers are math geniuses but I think you'd have to agree that getting from $14.62 to $17.65 is more of an increase than getting from $1000 to $1024? I think silver made about a 18% gain while gold had to settle for a mere 3% gain.

So, yes, I like the shiny gold, I admit! And yes, it is more precious but for my normal investments, like shares and the junior market I prefer the leverage I get in silver over gold.

It's just personal preference I suppose.

So, to continue with the chart and my motivation for my comments, well, you see, first and foremost if we break $17.00 from here...and with the emphasis on here...then I really don't know where this has to go, daily then. Only to say that from here on down and below $17.00 would be Christmas Silver Shopping Season.

MACD looks to be heading back up and the histogram already is showing signs of starting to decline back to zero and hopefully above the center line again. Now, it is too early to tell but it is on the chart so, the downward momentum has definitely decreased. Whether this holds I honestly don't know but the latest about the rising wholesale prices and the inflation fears will put an additional level of support under gold and silver?

To end my daily chart, plain and simple, there is more support to be found around these prices than there is resistance. Like electricity, silver will go the way of least resistance...that in my opinion is UPWARDS!

Silver Spot Weekly Chart
Silver Spot Weekly Chart December 15, 2009
Chart is courtesy of marketclub.
Marketclub - Silver Spot Trend Analysis Marketclub - Silver Spot Trend Analysis (What's this?)

On to the weekly then, well for one, there is the $16.00 support level which is a very nice thing to have. Since, earlier it was a resistance, now that we are steadily trading above that level it will act as support like it has in the past.

Why bring up the $16.00? Just to show that if silver does manage to break the trend line then $16.00 is the number I'm looking at to look for a bounce back up. Nothing wrong with being prepared either way,...is there?

For now, I will remain looking up and not down! We are still trading upwards and still in a clearly definable up trend. We are also still trading in our trend channel all be it that we are now at the bottom of our lower trend line.

Most important thing is, we are holding as you've seen daily and weekly.

So, not much more I can say here. We need to look for confirmation of this thing wanting to go higher from here. Silver could trade sideways for a bit longer before heading back up. Anything above $17.00 is still bullish, getting to far below $17.00 would be bearish and should put investors in alert mode.

So, to answer the question, will silver bounce back before Christmas? Well, it is already sorta doing that. Only thing left to do from here is get back to our earlier high of $19.45 and leave the under $19.00 zone behind us and in thus doing so creating a bottom and support at $19.00.

Lets take this one step at a time though, that means, daily, lets get back above $18.14 first and then look again.

Buy gold online - quickly, safely and at low prices
YeOldGoldNugget's links of interest

Buy gold online - quickly, safely and at low prices

Wednesday, October 28, 2009

Orko Silver Chart October 28, 2009

Orko Silver Daily Chart
Orko Silver Chart October 28, 2009
Chart is courtesy of marketclub.
Marketclub - Orko Silver Corp. Trend Analysis.

A quick update after a couple hours into trading. The downward force on the commodities markets is getting too strong for Orko Silver to bear. The 0.90 support has broken and we are looking for support of the 50 MA line around 0.85. If that doesn't hold this stock will go down to around 0.81 before we will see selling pressure decline and buying increase.

Like I said yesterday, we will see 1020 in gold and 16.00 in silver before we will see renewed interest.

Orko Silver Daily Chart Update
Orko Silver Chart October 28, 2009
Chart is courtesy of marketclub.
Marketclub - Orko Silver Corp. Trend Analysis.

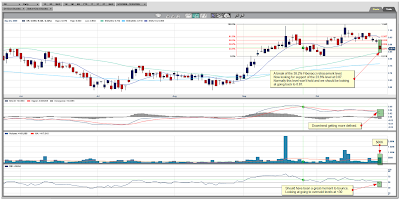
My earlier chart has an error on it. The Fibonacci Retracement lines should be drawn like on the updated chart. The 0.90 was a support but in my updated chart this coincides with the 38.2% Retracement level. The top should coincide with the 100% level and the bottom and thus, the start of the uptrend, should coincide with the 0% Fibonacci Retracement level. We are now retracing from an earlier uptrend.

2009 Copyright Northwest Territorial Mint - 100oz BarAs you can see from the chart we are now hovering at 0.87 which coincides with the 23.6% Retracement level. Normally, when a stock has had an uptrend and we get a pullback, traders look at a bounce back up from either the 61.8% or 50% level. Now, since we have already broken through those levels it is unlikely the 23.6% Retracement level will act as a support. Only thing that will add a bit of support around the level where we are now is the 50 MA line which coincides with somewhere around 0.85.

If tomorrow the 16.00 for silver holds then Orko Silver will hold around 0.85 and 0.87, if it not only holds but we get a bounce up for silver then most everyone will decide the bottom has been set and will start buying again and we might get a close in the green. That would be the optimistic picture which I'm holding on to for now.

Google Finance Sector Summary Chart
Chart is courtesy of Google Finance

Some heavy losses across the board and the commodities markets are bearing the brunt of taking the biggest losses inflicted today.

Gold Spot Daily Chart
Chart is courtesy of marketclub.
Marketclub - Gold Spot Trend Analysis.

Gold BarAs you can see from the gold chart I posted. There is the potential for an even bigger drop, that is if the 1017 or 1020 supports don't hold. Just as you know, it is not out of the ordinary for gold to make such a correction before heading further up. The RSI and stochastics are indicating we are at or very near oversold levels so a possible reversal could be soon knocking at the door.

Just pray or whatever one does, rub your gold coin, that the 1017 and 1020 hold cause if they don't better make sure to get some money on the sides cause it will be bargain shopping time again across the junior markets. For the day-traders, get out there where you have enough profits and get in where prices are cheap and fundamentals are strong.

Don't take losses easily, do so only after the fundamentals of the company you are invested in have changed for the worse.


YeOldGoldNugget's links of interest

Wikinvest Wire


Watch INO TV for FREE now.

Orko Silver Corp. Chart


MarketClub Free Trial - Tools for the Trader

24 Hour Spot Silver (Bid)

Live 24 hours silver chart [ Kitco Inc. ]

Buy Gold Online - BullionVault

Buy gold online - quickly, safely and at low prices

Educational Videos - Market Analysis

Watch the latest educational videos from MarketClub by Adam Hewison