Buy gold online - quickly, safely and at low prices
Showing posts with label Breakout. Show all posts

Friday, November 27, 2009

Silver Could Be on One Heck of a Ride!

Silver Spot Daily Chart
Silver Spot Daily Chart November 27, 2009
Chart is courtesy of marketclub.
Marketclub - Silver Spot Trend Analysis Marketclub - Silver Spot Trend Analysis (What's this?)

Couple of highlights, well,...a lot of highlights on this chart actually. The most important ones on this chart however would be the divergences. Take a look at the chart and in particular last year August 2008. You'll see the red line I've placed there following the lower lows silver is making. This line is thus sloping downward.

Tilt your eyes a bit down and look at the other red line below the MACD. That line is making higher lows. So, there is a divergence because the MACD is advancing upwards before the stock is doing so. The stock at that moment is still trading downwards. Taking a clearer look at the MACD you'll see it was making higher lows so there was a positive divergence emerging.

100 Ounce Silver Bars Johnson Matthey and Englehard - Copyright © 2009 Northwest Territorial MintAs the naming implies, positive,...meaning a bullish signal. A divergence is also a clearer and more reliable signal then a simple MACD crossover. Even then, there are also different levels and strengths of signals, for instance, a crossover on the center line is a stronger signal than a crossover in the lower or upper zone while a divergence beats any crossover as to signals.

Now, move your eyes to the right to last September, notice the red line making higher highs? Now look down and take a look at the MACD. That one is making lower highs. So we have a divergence again. This time the MACD is down trending while the stock is still making higher highs. This is what is called a negative divergence and thus a bearish signal.

October 19th is when I would have gotten out when I would have been long. Taking some profits off the table and waiting for confirmation of the signal. This case, the divergence did in fact turn out to be a bearish signal as the stock made a clear break downwards from October the 25th.

So, look for those to aid, not to guide!

I've also drawn a resistance line across the chart at 18.00 which coincides with earlier points of support and resistance. Now, it is a resistance but one which soon will be broken and with great ease.

For now, I'm looking at a retest of either the 10 Moving Average or the bottom of the trend line which would be anywhere around the 17.00 level.

Do not however expect too much downward pressure on silver or gold as that will not happen. Up is still the trend. Short term thus maybe a little bit down but when we've taken our little breather I expect us to be trading back to where we left of sooner rather than later.

Silver Spot Weekly Chart
Silver Spot Weekly Chart November 27, 2009
Chart is courtesy of marketclub.
Marketclub - Silver Spot Trend Analysis Marketclub - Silver Spot Trend Analysis (What's this?)

Weekly is as usual where the magic happens! Silver's chart is no different here cause looking at this one is just like reliving October the 5th all over again. We are already trading above 18.00 and we are looking for a definite break above 18.00 on the weekly chart. Could silver finally be on the brink of making some of the same steady gains gold has made comparatively?

With that I mean, gold has since last year October 2008 not only reached its all time high, it has completely smashed it to smithereens! Silver has yet to hit that all time high but could be on the verge of doing the same. Don't know what will happen but the chart is telling me silver has some catching up to do and chart wise things are really lining up for a possible major increase or case of playing catch up.
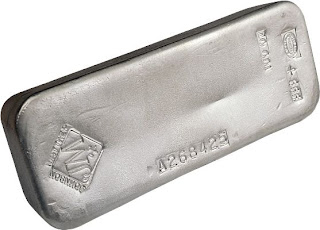
Bullion Johnson Matthey 100 Ounce Silver Bar - Copyright © 2009 Northwest Territorial MintYou can also see the upper trend line going up from October 2008 and after breaking that trend line in June 2009 and going further down we've made our new lower trend line which has held from July on.

What I'm looking at is adding an even higher trend line to the chart which should tell you I'm already looking at a silver price of 21.00. When silver breaks the upper trend line and thus breaks the 19.00 then getting to 21.00 is like talking a walk in the park.

MACD is trending up but the gap is not getting wider. Not yet anyway...that will come...only a matter of time. Just need to drop a little before taking out 19.00 and heading for higher highs.

Looking at both charts I'm extremely bullish on not only most silver juniors but as an investor in Orko Silver, of course also very bullish on the markets reaction towards Orko Silver when the spot price of silver is looking to break 19.00 and more to come in the weeks ahead.

Now, I have no crystal ball but I do try to recognize turning points and have on occasion spotted them in the past so maybe just need to go with the flow.

Last thing, don't get scared riding gold or silver's wave. To those who've followed today's action in gold will know that any down attempts are quickly brought back up again. Like clockwork. Too much basis and fundamentals for gold not to go higher. My 2 gold-nuggets then.


YeOldGoldNugget's links of interest

Tuesday, November 24, 2009

Orko Silver Chart November 24, 2009

Orko Silver Daily Chart
Orko Silver Chart November 24, 2009
Chart is courtesy of marketclub.
Marketclub - Orko Silver Corp. Trend Analysis Marketclub - Orko Silver Corp. Trend Analysis (What's this?)

The daily chart now shows in clearer detail the breakout which happened on November the 16th. If you take a look at the volume chart you'll see that volume has been steadily building up since the start of this rally November the 10th. On and off we've seen 353K, 402K, 545K and 732K shares being traded with the larger volumes being seen since breaking resistance at 1.00 at November the 16th.

When I take a look at the Moving Average Convergence Divergence (MACD) you can see we've had the bullish crossover a couple of trading days ago and we are still up-trending. There is as of yet no sign of any reversal showing up on the daily. (Divergence still positive)

Relative Strength Indicator (RSI) is now just about getting back at the start of being overbought. I say, at the start cause even on the daily chart Orko as we can see from the rally from early September, Orko can stay in the overbought zone for a prolonged time. We are now only a couple days in overbought so still nothing to worry about as far as I'm concerned.

Orko Silver Corp - Developing one of the world's largest Silver deposits
Trading action today again very solid. To most it will seem just like 200K shares traded but take a look at the orders which weren't filled so today again very solid action.

Most juniors were trading down and Orko was trading up and managed to close at 1.18+0.04 (3.51%). All in all still very pleased with the action going on in Orko. What does one need more, this has it all for the short-term trader AND for the long-term trader. For a short-term trader, just take a look at the chart, buy early September, get out September 25, get in early October, get out late October,...

Orko Silver Weekly Chart
Orko Silver Chart November 24, 2009 (Weekly)
Chart is courtesy of marketclub.
Marketclub - Orko Silver Corp. Trend Analysis Marketclub - Orko Silver Corp. Trend Analysis (What's this?)

On to the weekly where we try to spot the expected longer term trend. From the weekly you'll see on the MACD chart that we are only since the start of October trending above the MACD center line. That fact and the fact that we are trading above all Moving Averages bodes well for Orko long term.

Also from the chart you can see the resistance line I've drawn at 1.00 and the bottom at around 0.80. The 1.00 seems pretty clear to me. The 0.80 is found by looking at the 200 MA, you'll see that from the start of the big drop from April 2008 to about September 2008, there is some sideways action going on around 0.80. Besides this, getting under 0.80 there would mean going under the 200 MA. The 0.80 has acted as support and resistance before.

Placing some Fibonacci retracement lines on the chart from our high of about 2.00 and our low of 0.28 gives us 1.14 as another key point as this coincides with the 50% Fibonacci. Fibonacci wise our next target should be 1.34.

Would be a very hard feat for YeOldGoldNugget to describe these charts as being bearish in nature if not near impossible.

This Bull has HornsNope, this bull has horns and some very nice ones mind you. Should be clear to individuals, funds and computer programs that Orko is trading up from here. With Pan American Silver again stating very clearly to have a production decision ready on La Preciosa by the end of 2010 I do not think I need to draw a little picture for visual purposes as to where this thing is going to go...do I?

I think most can do their own maths on that. Here's a little blast from the past and from when I just started up my blog on Orko. Doesn't the low seventies sound cheap now? Back then it probably wasn't to most. That is why it is so important to do your own due diligence, find a stock which you like, with decent management, approachable to shareholders, valid track record, good project(s), plenty of funding, interest from junior/senior...AND STICK WITH IT!

That would be my advice anyway as a long term holder. For the surfers amongst us, please ride the long waves only, don't bet against our precious Orko by going short. That is bad JuJu! The market will punish you for it I'm sure.

I think that's about all I have to say for the moment about Orko. One more thing though, I was going to do a gold chart but time is short so this will have to wait till tomorrow. Only two things I have to say right now, never a bad idea to take some profits off the table and also never to go against the trend. Though I recognize the overbought and the big rally without correction I still find it extremely dangerous betting against this rally. More on that tomorrow.


YeOldGoldNugget's links of interest

Sunday, November 22, 2009

Mexivada Mining Corp. Chart November 20, 2009

Mexivada Mining Corp. Daily Chart
Mexivada Mining Corp. Chart November 20, 2009
Chart is courtesy of marketclub.
Marketclub - Mexivada Mining Corp. Trend Analysis.

Mexivada Mining CorpSome Friday's action that was wouldn't you agree? I am a shareholder of Mexivada Mining Corp. myself and got contacted by a friend who asked me if I would do a chart of Mexivada and I was of course happy to comply with his request.

Hadn't he asked me I'd probably had done one myself considering the perfect breakout and trend reversal popping up on Mexivada's chart.

If you care to take a look at the daily chart you'll see I've put some Fibonacci lines on there. I took extreme care in placing and aligning the Fibonacci lines. The only way I think they could be placed is by aligning the 23.6% line with the bottom at 0.185. That very same bottom which on October the 8th acted as a support as you can see from the chart. From that day on we went back up again.

Sadly, the rally which started October 8 failed to cross the 50.0% line, it however made a high of 0.31 and thus just reached it but from that day on October the 13th the stock was destined to fall back to the support level of 0.185. That low was hit on Thursday and Friday people woke up, realized,...WOW...undervalued, hit low,...MUST BUY!

Anyone wondering what happened Friday. That is what happened. Market realization in full effect!

Looking at the Moving Average Convergence Diagram (MACD) we see a very bullish center line crossover coming on the charts which is very very bullish.

On the daily chart with Friday's action we have broken above the 10 MA (Moving Average) AND above the 30 MA. There are no better indicators to tell a chartist that this stock is on the move again! Extremely bullish I'd say. I love to do charts like this with all these aligning indicators turning positive and bullish.

So daily looks very very good indeed. On to the weekly.

Mexivada Mining Corp. Weekly Chart

Chart is courtesy of marketclub.
Marketclub - Mexivada Mining Corp. Trend Analysis.

What does this tell us. Could the positive daily chart turn into a negative by looking at the weekly? Well, in short. NO! Definitely not!

You can clearly see the 0.20 line here acting both as support AND resistance. (also when I say 0.20 I mean somewhere between 0.18 and 0.20) Now we have come to the time where the 0.20 will start acting like support instead of acting like a resistance like it did early 2009.

What can one see more from the weekly. Well, last week could turn out to be the turning point week for Mexivada. After 7 weeks of mostly down trading and mostly red candles at least since last week finally a very distinguishable large blue candle.

Also on the weekly chart is what to me looks like a Rising Three Methods pattern emerging. Now, I know, I use it on the weekly chart and it are not 3 days/3 candles and such....well...one method, two methods or three methods,...either way I look at it...this thing is going up no matter how many methods!

YeOldGoldNugget is bullish on Mexivada.

My further advice, if this ever gets at or below 0.185 again....START BUYING.

Mexivada Mining Corp.
YeOldGoldNugget's links of interest

Sunday, November 8, 2009

Orko Silver Chart November 06, 2009

Orko Silver Daily Chart
Orko Silver Daily Chart November 06, 2009
Chart is courtesy of marketclub.
Marketclub - Orko Silver Corp. Trend Analysis.

Nice action on Friday. We had Orko Silver opening at 0.99 which sadly didn't last for very long it seemed at first. Well, if you take a look at the Kitco silver chart you'll see from the red line that silver got pulled down from 17.55 to 17.35 but then rallied again to 17.60.

If you take a look at the 5 day chart in Google for instance, you'll notice Orko Silver following the drop and rise perfectly. Now that does not mean that Orko Silver is a good silver indicator. Hardly! But taking a look at the following charts shows that at least since the last two months Orko Silver is again following the price of silver.
Orko Silver Daily Chart November 06, 2009
Silver Spot Daily Chart November 06, 2009Continuing with the chart, from the MACD diagram you can clearly see a bullish crossover is appearing on the chart which is of course a positive sign. A little past eleven we had a little handshake with 1.00 after which we said goodbye and started trading lower until we reached 0.94, our low of the day at around three o clock. So, to get Orko Silver to drop from 1.00 to 0.94 took about 55K shares being upped for sale of which 17.5K were actually sold. A last minute buyer managed to buy some 1500 shares and pulled us up right back to where we started from and thus to a close of 0.96.

Orko Silver Corp Level 2 Quotes - Hotstocked.comYou can also see from the chart and the trend lines I've drawn that since this week Orko Silver has broken out of its downward sloping trend channel. That happened on November the 3th on which we saw Orko Silver opening at 0.86 and closing at 0.97, gaining 0.11 cents. So that was the break. The following days we've been holding above 0.95 and last Friday might possibly be the start of a confirmation of Orko Silver finally making a break, a close and a hold above 1.00.

One only has to look at two points, September the 18th, large volume of 2.5 million, a break above 1.00 but no continuation, October the 14th, large volume of 1.1 million, a break above 1.00 but no continuation.

After these two we look out for our third one, November the 6th, only a little brush with 1.00 and insignificant as our third day,...waiting thus for the next day with big volume.

I'll tell you this, the next move with the right volume not only will bring us over 1.00, it will also keep us above 1.00 this time around. So, what am I expecting from Monday? I expect Orko Silver to make another break for the 1.00. If you happened to read my last article on Gold Breaking Out of Upper Trend Channel then I'm sure you know how I feel about it.


YeOldGoldNugget's links of interest
Buy gold online - quickly, safely and at low prices

Saturday, November 7, 2009

Gold Breaking Out of Upper Trend Channel

Gold Spot Daily Chart
Gold Spot Daily Chart November 06, 2009
Chart is courtesy of marketclub.
Marketclub - Gold Spot Trend Analysis.

Lets start by taking a look at the daily chart of gold. As you'll notice I've marked some important highlights on the chart. The bigger, the upper and the lower trend channel are of importance. I've only ever seen others using the lower channel and that is something that I do not get? Why limit yourself, why limit gold in such a narrow space while the last couple of months have shown and proven that gold is ready and has been ready since 2008 to get into a higher trend channel. The lower and center one just...

DO NOT QUALIFY ANYMORE!

I think we have passed that time frame. When I wrote my article at the beginning of October 2009 I was not kidding with the Neon signs.

You can see from the chart why I started using the bigger trend channel. If you take a look at December 2008 you'll see gold made 2 runs for the upper trend line. After the first rally gold consolidated to the 10 MA line and after the second rally gold consolidated to the lowest trend line. From that point which is around January 15, 2009 gold starts to move to the upper trend line and hitting the upper trend line the 23th of January. If you look closer you'll see from that moment that gold keeps trading on or around that upper trend line and does so till we reach February the 10th, 2009.

Johnson Matthey 1-Kilo Gold Bars - Copyright © 2009 Northwest Territorial MintGold then again rallies further above the upper trend line before hitting a high of about 1006 on February the 20th, 2009. It then drops to...AGAIN...the upper trend line and keeps trading at that level for several days until we hit March the 19th, 2009 and reach a point where gold makes a drop towards the lowest trend line. It then plays a bit with the lower trend channel and reaches a low at April the 19th, 2009. Gold starts to rise again and this time back to the upper trend line. It does so, not in a straight line up but with a lot of trading around the center or rather the upper trend line of the lower trend channel.

Gold reaches the upper trend line around the start of June 2009. It then drops again with as target the lowest trend line but only drops after maintaining a 15 day close contact with the center trend line before saying goodbye to it and at the start of July 2009 we see gold moving away and dropping towards the lowest trend line and hitting that, July the 12th, 2009.

From this moment, July the 12th, 2009 could very well be the last time gold is trading in this lower trend channel and thus the lower prices. As you will see from the start of September 2009 there is a break from the lowest trend line, keeping tight contact with the center line before reaching October 2009 and making a break for the upper trend line, consolidating only once in the process. That happened just last week and now we're already firmly back at the upper trend line and as of November 3, 2009 we have broken the upper trend line and have kept above it for 3 days now.

MACD looks good. You'll see that MACD keeps making higher and higher bottoms which is very bullish to put it mildly. RSI only just reached overbought but as you can see and as I've explained before, gold can stay in overbought zone for days and weeks on end. When fundamentals are strong then forget about looking at RSI, better then to look at Stochastics. To each their own of course. Whatever works for you.

Let me continue with the weekly chart.

Gold Spot Weekly Chart
Gold Spot Weekly Chart November 06, 2009
Chart is courtesy of marketclub.
Marketclub - Gold Spot Trend Analysis.

OK, the weekly chart, this is where we establish and confirm the trend AND direction. Read the highlights and then tell me what you think what all that means and where you reckon gold will go to next? Up or down? 1500 or 750? Who's with me on the 1500? You'll see from the start that September 2007 gold started rallying and didn't stop until it gained...

A WHOPPING 350 POINTS

That brings us to the big consolidation starting around mid March 2008 and bottoming out at the height of our crisis in October 2008. You will remember remember, the 5th of November 2008 or rather the months when all the stimulus package were announced and in fact the very same months that the printing presses were doing overtime.

Sure, it has been a bumpy ride but if you look from the weekly chart, gold not only broke out of our weird Elephant man's right shoulder at the beginning of October 2009 but gold also remained firmly held between the trend lines of the greater trend channel and has since this week broken the upper trend line and is holding above it.

Now, does YeOldGoldNugget dare to say that we are now again at a possible breaking point?

YOU BET YA

Maybe something like what happened at the start of October 2009, maybe a bigger move? Will that rally start right now or will we first make a consolidation? Who knows? One thing I do know, time to go short or bet against rising prices,...probably not THE smartest of things to do right now. If not something you take from this article then maybe this would be a good one to remember.

Also, one of the things most people throw around as argument, or basically because they really don't get it, anyway, it goes like this, 'Gold is just another bubble'...is what they say.

You know what YeOldGoldNugget says about that?

Empty Gold BalloonI'd say we are about this far in our bubble (See image for visual representation). Oh, Oh, Oh, but but...is how it goes when I counter argument them...before they slam another totally idiotic remark my way.

You really have to be sitting down before you read this, better yet, secure yourself firmly to your seat before reading their next moronic argument. Ready for it?

Just see what happened to oil when it reached $147!

Yeah yeah, that might very well be about oil being a bubble, but comparing gold to oil? Comparing gold, a substance which is so rare, which has been used throughout ages and centuries as a precious commodity and a means of preserving wealth. A substance which not only is rare but is rare for a very specific and just meaning. Gold is not formed on this planet, it is formed in our universe. Also, when I say universe I'm actually undervaluing the rarity.

SupernovaGold is not just created in the universe, for gold to come into existence, enormous forces are required. Not even the forces of nuclear fusion working frantically in the center of stars suffice for gold's needed reaction to happen. No! For that to happen we need our stars to go SUPERNOVA!

Only then are circumstances at an ideal for gold to be formed. And no, YeOldGoldNugget is not sucking this one from his thumb. There are some great study's which have been done about the necessary requirements to create gold.

Well, don't know whether you heard the story about turning lead into gold? Turns out those alchemists or transmutationists of back in the days might have not been that stupid at all...at least not in their thinking pattern. Turns out they started with the wrong compound - and a tad short on the required energy - but were right about the process being a possibility. It is thus actually possible to create gold on this planet. Not by using lead mind you but by using an isotope like mercury.

And that is just the start of your efforts, that was the cheapest part by the way, the mercury. However, mercury or Hg as its known from the periodic table has 80 protons. Gold or Au has 79 protons. So, mercury seems to have one proton to many! But since it is the closest family to gold, a prime candidate for our experiment. Sadly, to get mercury to ditch its 80th proton we need a process called electron capture which is performed in a nuclear accelerator. Bombarding our mercury with enough high-energy neutrons will do just that...leaving us with pure gold!

AlchemistSo yes, those alchemists were quite right, however, turns out if they were looking to create a penny's worth of gold from mercury it would take them and are you ready for this... 1,000,000,000,000,000,000,000,000 years. I do not take credit for the calculation, for that you need to contact Barry L. Berman who is a physicist at George Washington University.

Oh oh oh, I hear, and what about gold's other closest family in the periodic table. 'Left' next to gold so to speak. Who is Mr. Proton 78 looking to trans mutate into Mr. Proton 79? Well, turns out its quite a familiar presence.

Meet Mr. Platinum! Trading at or about $1340. Hm? Using something which is valued at $1340 to create something which is -now- valued at $1090? Well, it is scientifically possible but needless to say...even costlier than using mercury.

This following calculation was found on the Cosmic Conservative website.

The best estimates I’ve seen put the total weight of gold ever mined to be about 160,000 tonnes. A tonne is 1,000 kilograms, so that’s 160,000,000 kilograms. Gold weighs 19.3 grams per mililiter. A mililiter is one cubic centimeter. 160,000,000 kilograms is 160,000,000,000 grams. Which comes to roughly 8,300,000,000 cubic centimeters. There are 1,000,000 cubic centimeters in a cubic meter, so that means the volume of all the gold ever mined is about 8,300 cubic meters of gold. That’s roughly a cube of solid gold 20 meters on a side, or about 65 feet on a side.

In other words, all of the gold ever mined in the history of the earth would fit in a moderately sized house.

So, whenever you hear someone mentioning those two ridiculous claims towards gold then you'll know what to tell them! Comparing oil, a mix of naturally occurring organic compounds from within our earth and which are basically made up of nothing more than hydrogen, carbon and oxygen...TO GOLD? Heretics! The nerve of some people! Any reason is reason enough to drag gold down I suppose. Good luck with that trading strategy in the coming years ROLF :-)

Buy gold online - quickly, safely and at low prices
YeOldGoldNugget's links of interest
Buy gold online - quickly, safely and at low prices

Thursday, October 15, 2009

Orko Silver Chart October 15, 2009

Orko Silver Daily Chart
Orko Silver Chart October 15, 2009
Chart is courtesy of marketclub.
Marketclub - Orko Silver Corp. Trend Analysis.

A quick run down here. Orko Silver opened lower at 0.98, silver by then was already trading lower around 17.40. The morning trading saw some big volumes of shares traded which got the price up to 1.00. Sadly a little after twelve silver got pulled down again pulling down on commodities.

All in all not a bad day, again very large volume of shares traded, around 830K. But that's not all, I missed this one, got alerted to it by another Orko Silver trader and after checking it out I must say that indeed that looks like a Cup and Handle continuation pattern. There are some points to consider whether this qualifies as a Cup and Handle.
  1. Trend: To qualify as a continuation pattern, a prior trend should exist. Ideally, the trend should be a few months old and not too mature. The more mature the trend, the less chance that the pattern marks a continuation or the less upside potential.
  2. Cup: The cup should be "U" shaped and resemble a bowl or rounding bottom. A "V" shaped bottom would be considered too sharp of a reversal to qualify. The softer "U" shape ensures that the cup is a consolidation pattern with valid support at the bottom of the "U". The perfect pattern would have equal highs on both sides of the cup, but this is not always the case.
  3. Cup Depth: Ideally, the depth of the cup should retrace 1/3 or less of the previous advance. However, with volatile markets and over-reactions, the retracement could range from 1/3 to 1/2. In extreme situations, the maximum retracement could be 2/3, which is conforms with Dow Theory.
  4. Handle: After the high forms on the right side of the cup, there is a pullback that forms the handle. Sometimes this handle resembles a flag or pennant that slopes downward, other times just a short pullback. The handle represents the final consolidation/pullback before the big breakout and can retrace up to 1/3 of the cup's advance, but usually not more. The smaller the retracement is, the more bullish the formation and significant the breakout. Sometimes it is prudent to wait for a break above the resistance line established by the highs of the cup.
  5. Duration: The cup can extend from 1 to 6 months, sometimes longer on weekly charts. The handle can be from 1 week to many weeks and ideally completes within 1-4 weeks.
  6. Volume: There should be a substantial increase in volume on the breakout above the handle's resistance.
  7. Target: The projected advance after breakout can be estimated by measuring the distance from the right peak of the cup to the bottom of the cup.
Taken from stockcharts.com

I'd say we qualify based on those points!

If the breakout occurs then we are looking at a possible target of 1.40 which is the depth of the cup added to the high of the cup. That would be adding (1.00 - 0.60) + 1.00 = 1.40

Lets hope the pullback in gold and silver is over and done with quick smart. Its just a pullback. Gold pulled back to the 10MA line and that was with hitting a low of 1046. Silver did the same however it made a bigger dip under the 10MA and hit a low of 17.29.

Gold and silver could fall a bit lower to complete the shake out and then head up again to continue making the run to breach 1100. Now, that will not be this week but it will come on the boards in the time to come.

YeOldGoldNugget's links of interest
Buy gold online - quickly, safely and at low prices

Monday, October 5, 2009

Orko Silver Chart October 05, 2009

Gold Spot Daily Chart
Gold Spot Chart October 05, 2009
Chart is courtesy of marketclub.
Marketclub - Gold Spot Trend Analysis.

Today I will start off by showing a couple gold charts to try to better visualize as to where we are right now and what we're looking at near term (you can do your own diligence as to where I see silver going after reading this). This is always one of the hardest things to do reading the chart of gold at a time like this where gold is trading just below, just over or looking to break the all time high. Lots of different factions with opposing interests will each try to do their bit in getting this thing either to keep from breaking the all time high or breaking it and leaving it wondering what the heck just happened while already history books have marked that moment as the last days of the three digit gold price.

What do I think? Well if this were a simple neon sign I'd say it was something in the likes of this :


A tarot card reader would tell you its what the cards are telling him, a poker player will tell you its how the cards are played and how the deck is stacked. For me, its a combination of the three. The cards in this case are telling me the next card in the deck will be the ace, from the looks of the dealer I'd say the deck is rigged, in the corner of my eye I see a faint shadow moving as swiftly as the wind, I know the deck rigging issue is not a problem anymore, as for how its played, well, how do you play a Diamond Diamond Card Figure Royal Flush on the river?

Now to get back to the White Knight issue, lets take a look at following chart.

Gold Spot 5 Minute Chart
Chart is courtesy of marketclub.
Marketclub - Gold Spot Trend Analysis.

I don't really think that needs much explaining. Pretty much every action that drove the price too far beneath 1000 got immediately countered by strong consistent counter buying keeping the price above 1000. Definitely a tug of war going on this time. Neither last years rally in March 2008, nor this years rally in February 2009 have seen this kind of highly bullish action.

Something is afoot and I honestly can't tell you whether this means we will actually see someone's foot ending up someone's behind for failing to short gold this time around or whichever way this goes, if this were like the doomsday clock it would already be pointing at 5 minutes to midnight. I'd leave it to all to make up their own minds on that one.

Orko Silver Daily Chart
Orko Silver Daily Chart October 05,2009
Chart is courtesy of marketclub.
Marketclub - Orko Silver Corp. Trend Analysis.

Orko Silver was quite the surprise,...is what I would have said if I were writing this last week. However, looking once again at what happened with the price of silver one need not look to far for possible reasons why this closed in the green today. Like gold, silver made its similar high spike a couple minutes for noon. Maybe that's what it is indicating.

HIGHNOON.

Yes, that must be it, like in the Wild West stories, coincides perfectly with the spike.

Orko Silver opened at 0.82 which was quite a bit lower than Fridays close of 0.85. This lower opening did however coincide perfectly with the 0.82 of just a couple weeks ago from when this rally to breaking the 1.00 started. We already saw the 0.87 on the boards during the morning hours but it didn't hold. During the rest of the afternoon and with silvers steady up march each other passing hour added another Canadian cent and we managed to close at 0.87 +0.040 (4.82%).

I need Orko Silver to trade above 0.90 again to confirm the bottom at 0.82 and to confirm the end to the recent downward momentum and with that the start of another run up to break and stay above 1.00.

Exciting times ahead. As always, take care and prosper. If anyone has any thoughts they'd like to share, be sure to leave a comment.

Thanks go to Icons etc for the Neon icons.

YeOldGoldNugget's links of interest
Buy gold online - quickly, safely and at low prices

Wikinvest Wire


Watch INO TV for FREE now.

Orko Silver Corp. Chart


MarketClub Free Trial - Tools for the Trader

24 Hour Spot Silver (Bid)

Live 24 hours silver chart [ Kitco Inc. ]

Buy Gold Online - BullionVault

Buy gold online - quickly, safely and at low prices

Educational Videos - Market Analysis

Watch the latest educational videos from MarketClub by Adam Hewison