Buy gold online - quickly, safely and at low prices
Showing posts with label Average Directional Index. Show all posts

Tuesday, December 22, 2009

Orko Silver's Strong Performance

Orko Silver still going strong.

Orko Silver Daily Chart
Orko Silver Daily Chart December 23, 2009
Chart is courtesy of marketclub.
Marketclub - Orko Silver Corp. Trend Analysis Marketclub - Orko Silver Corp. Trend Analysis (What's this?)

Well, not much has changed since I wrote up my last chart. Not for Orko Silver anyway which is still going strong despite a correcting gold and silver market. Just goes to show how a stock gets a reputation of being a strong performer. That title in my book at least is also bestowed on stocks that can witter any storm.

Just compare Orko Silver to most other stocks. Result. Orko holds, most others drop!

Besides that, just take a look at some of the profits one could have taken since Orko Silver started its up march. From early September trading around $0.60 and going to $0.90 up to November for a 50% gain. Then, from early November from $0.90 to around now $1.25 for another near 40% gain.

Also, just take a look at some of these volumes of the last couple of days :
  • December 16, 2009 Volume 875K
  • December 17, 2009 Volume 689K
  • December 21, 2009 Volume 447K
That is some very steady trading to put it mildly. I don't know why but I have the feeling that someone is loading up on shares around $1.20. If that is the case than when this party is done with their Christmas shopping then I expect we could see the start of another UP rally.

I think we have plenty of support at $1.00 and some additional support at $1.10. Anything below that is buying opportunity in my book and that is not saying that it still isn't cheap at $1.20...cause it is.

MACD or the Moving Average Convergence Divergence indicator is trending downwards but not with such strength so as to be concerned. I think this will bounce back up way before we hit the center line. This already shows in the histogram. As you see, the histogram is not increasing but remaining the same.

From the chart we can also see we are still trading above all Moving Averages, and above, well sorta cause we are right at the 10 MA which is around $1.20

So on the daily, I still do not see any considerable downside from here so therefor I must conclude that until said party is loaded up we will remain pricebound around these prices of $1.10 to $1.25.

Orko Silver Weekly Chart
Orko Silver Weekly Chart December 23, 2009
Chart is courtesy of marketclub.
Marketclub - Orko Silver Corp. Trend Analysis Marketclub - Orko Silver Corp. Trend Analysis (What's this?)

Weekly, still looking at a BULLISH chart. There is this small delay in Durango station we are experiencing but I reckon we are just loading up on passengers until the Silver Train is fully booked up and ready to go!

The rise in average volume can clearly be seen on the weekly chart. I've drawn a red arrow beneath the red line to visualize this. So, more and more shares are changing hands.

MACD is trending upwards and above the center line and thus our UP trend is still intact.

Orko Silver Weekly ADX Chart
Orko Silver Weekly ADX Chart December 23, 2009

I've also added the ADX chart. Again on the ADX, the Average Directional Index can determine trend strength regardless of the market direction. This non-directional oscillator is based on a range of 1 to 100 (although movements over 60 are rare). If the line is under the 20 mark, the trend is considered to be weak. If the line is above the 40 mark, the trend is considered to be strong. The ADX line is built on the results of two separate technical indicators, the +DI (force of up-moves) and the –DI (force of the down-moves). The default for this study is 14 periods which takes into the consideration the measurements of the +DI and –DI for the last 14 periods.

Knowing this and taking a look at Orko's ADX...clearly UP and the trend is qualifying for a STRONG rating.


YeOldGoldNugget's links of interest

Tuesday, December 15, 2009

Is Gold Ready for its Next Move Up?

Gold Spot Daily Chart
Gold Spot Daily Chart December 15, 2009
Chart is courtesy of marketclub.
Marketclub - Gold Spot Trend Analysis Marketclub - Gold Spot Trend Analysis (What's this?)

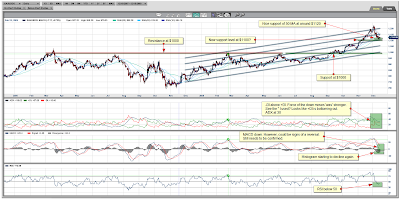
Well, after doing my silver chart last night I also did the daily and weekly chart of gold but didn't get around at posting them. I now have a little bit more time so here it goes. The charts are from last night so gold was then still trading at $1124 and has as of this morning increased to around $1130.

So, the idea I had last night and earlier this week is only being confirmed. We are however still not in the clear. For that to happen I'd like gold to trade again above $1150. There could thus still be danger from breaking down.

But, looking at the chart, gold seems to have found support at the 50 MA around $1120. So that means the $1100 is hopefully slowly but steadily disappearing from our sights.

I've also drawn another support level at $1100 because of the action in mid November and the trend line which rests at that level now. So that means there is some additional support for gold here and that could thus explain why the 50 MA held and why gold is trading back up from here. Maybe more investors are seeing this as support?

From the chart you can see that the Average Directional Index has turned down since hitting our high of $1126.37 and the ADX went from over 40 to about 30 now which is still within acceptable boundaries for me. As you also can see, the +DI has now turned down and is now below the -DI. This means that the force of the down move (-DI) was stronger than the force of upward moves.

So, if I only was to look at the ADX indicator then this chart would be deemed negative...however looking at all other indicators makes me wonder if like silver, gold is not finding some support here, new momentum and a perhaps a fresh leg up from here?

MACD looks bearish and is turning down. However when I look at the histogram I see that one declining which also leads me to wonder whether this is looking to head back up?

RSI or Relative Strength Index tells me we are again in buy territory. Sure, we are not below 30 and thus not oversold but around 45 is plenty of room for gold.

Thus, to recap my daily, the same pretty much holds for gold as I indicated in my silver chart. In gold's case, we need to hold the $1100 and for silver we needed to hold the $17.00.

To me there are enough indications which could indicate that we should be looking up from here instead of further down. If gold however decides to move to $1100 and break the trend line then all bets are off and I will be forced to look at lower levels.

Gold Spot Weekly Chart
Gold Spot Weekly Chart December 15, 2009
Chart is courtesy of marketclub.
Marketclub - Gold Spot Trend Analysis Marketclub - Gold Spot Trend Analysis (What's this?)

On to the weekly then, this chart of course looks better than the dailyy cause the correction we had from the last couple of days just looks like a tiny blip on my weekly chart. Nothing to worry about anyway.

Weekly I'm still looking at my target of $1350.

The correction which started December the 2nd has brought us from $1226.7 down two trend lines and we are holding on the weekly 10 MA.

Weekly thus gold is still trading above all Moving Averages which is of course a good thing. Also, MACD tells me gold is still in an up trend as we are trading above the center line. There is a small correction noticeable in the blue line which is now turning down but that doesn't mean anything right now. Histogram has declined a bit which is a negative but looking back at the correction nothing to worry about and perfectly normal.

ADX on the weekly is clearly still bullish and the force of up moves is still far greater than the force of the down moves.

To summarize...YeOldGoldNugget is still looking at a bullish gold chart and combined with that some pretty exciting months bound to come.

Buy gold online - quickly, safely and at low prices
YeOldGoldNugget's links of interest

Buy gold online - quickly, safely and at low prices

Wikinvest Wire


Watch INO TV for FREE now.

Orko Silver Corp. Chart


MarketClub Free Trial - Tools for the Trader

24 Hour Spot Silver (Bid)

Live 24 hours silver chart [ Kitco Inc. ]

Buy Gold Online - BullionVault

Buy gold online - quickly, safely and at low prices

Educational Videos - Market Analysis

Watch the latest educational videos from MarketClub by Adam Hewison