
Chart is courtesy of marketclub.
Marketclub - Orko Silver Corp. Trend Analysis.
A lot of highlights on my chart as you will notice. I will try to explain cause there is an order in them. They start at the left following each candle and explanation. Here it goes, for those who remember my October the 5th article I did in which I made it quite clear as to where I thought we stood and what one should do at that moment. Well, that October the 5th was actually the start of the rally in gold reaching 1070.
It was thus also the start of the rally for Orko Silver and at that very point in time is where my 0.0% Fibonacci line begins. Exactly at the low of that very day which was about 0.816. The rally lasted until October 14, you can spot it on the last chart as it was the first red candle (hammer) after a long series of blue (green) candles.
That gave us the high of the rally and with that our 100.0% Fibonacci line. In our case this is 1.041. Those are the numbers, the rest falls into place as retracement levels. One normally draws a Fibonacci chart like in this case, after an uptrend has occurred and one needs to find out if a pullback occurs, at which levels there could be support.
You can see from the chart that after the rally the pullback was until the 50.0% Fibonacci line and that level held for 4 days when on day 5 we got the false breakout to the 61.8% retracement level. A sucker's rally is what it turned out to be, looking at in hindsight.
 After the false breakout, what actually was the breakdown in gold and silver we got our downward march. Luckily for us, the shakeout in gold came to a standstill and on our chart that perfectly coincides with the 23.6% Fibonacci level.
And as of this moment we are already heading back up.
So chart wise I'd like to see another up day tomorrow and a close above 0.95 which is a clear break of the 61.8% Fibonacci level but also puts us above the 10 MA line.
If that happens, all lights are green for the Orko Silver speed train to blast through 1.00 and beyond.
The momentum is definitely there, we had some decent volume being traded which was around 370K. Chart looks good again. Gold and silver look good to go again, the headlines making the news on Wall street were Stocks Rally Sharply On 3Q Gross Domestic Product.
Allow me to translate that one for my readers, I do provide media translation assistance, for a minor fee I will even come to your home and will translate directly all the news stories you are watching on your television station.
So, when it reads, Stocks Rally Sharply On 3Q Gross Domestic Product, that means,...
Pack your bags cause we are heading south again in Dollar-ville
So, on with Orko I have some latest news, some will already be aware of this but I wanted to make contact with management and have it verified before I posted it online.In discussion with IR :
- within 2 to 3 weeks we should get a couple of news releases regarding infill drilling, metallurgical testing and probably exploration drilling, starting next week with news on the infill drilling
- Ben and Gary in Mexico, returning end of next week
- George and Mike on their way back from South-Africa , returning early next week
- PAAS investing in infrastructure, roads, offices, power generator ,... at La Preciosa
Gold Spot Daily Chart

Chart is courtesy of marketclub.
Marketclub - Gold Spot Trend Analysis.

Chart is courtesy of Kitco.com
You can clearly see that yesterday, Wednesday October 28 at around 16:00 we made what looks like our first bottom at around 1026. From there on some slow but steady progress, until next morning that is because after only 25 minutes into opening at the New York Nymex there were some strong buyers lifting the price from 1032 to over 1037 and a little while later we were already trading at 1046.
 You can see from Kitco's 3 day comparison chart and my chart that indeed getting over 1042 was needed to give this rally any sort of significance. Now that we have indeed broke our 3-day low, this now adds to the strength of our rally. It could have been different. Gold could have rallied to 1042 and we could have seen doubt or fear again. We didn't! Gold kept going and beat its 3-day low and is now looking to head back up the 10 MA line. That's not the line on the chart I've posted, it can only be seen on the daily chart.
That means that gold should head back up to 1055 and beyond. To keep it simple, on the daily chart all things that need to point up are pointing up so therefore I am looking first at getting to 1055. If that not only holds but has no problem going higher than it would be fair to assume that getting to AND over 1070 will not be all that far of a stretch.
Gold Spot Daily Chart Update
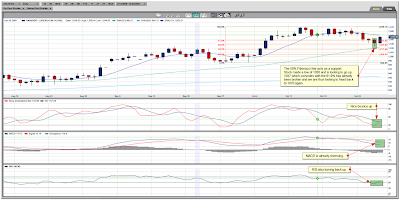
Chart is courtesy of marketclub.
Marketclub - Gold Spot Trend Analysis.
I've now posted the daily chart to put things into perspective. From today's action you can see we seem to have bounced back up from the 50.0% retracement level. The 0.0% Fibonacci I use here coincides with the low we made late September before we rallied to 1070 (100%). Getting to and above 1050 would bring us back above the 10 MA line.
You can see that were we are at right now 1046, that this is above the 61.8%. Only thing that remains is the last little hurdle before we hit 1070 again.
YeOldGoldNugget's links of interest
- Has the Gold Market Topped Out?
- Has the S&P Index Topped Out for the Year?
- CRB Index insight video
- Are You Laughing or Crying About Markets?
- Introducing the Perfect Portfolio
- What does winter hold for Crude Oil?
- Free Email Trading Course Copy
- New Video: ETF GLD is analyzed


![Live 24 hours silver chart [ Kitco Inc. ]](http://www.kitco.com/images/live/silver.gif)


.png)







Now that is some buying in Orko! That is what I like to see! 400K! Come on!
ReplyDeleteBack to and above 1.00
Good day for gold and the PM shares. A false breakdown of HUI index below support and quick bounce back up above trend line is big help ...
ReplyDeletecheers, caffee
Good day indeed caffee, commodities were hurt most yesterday and the day before.
ReplyDeleteThose smart enough to to do shopping last night could have made some nice profits.
Let us hope the 1070 is quick to fall and we go up to see 1100.
Sweet Site ;-)
ReplyDeleteOrko goes up and no News on Channel?
I drink Tea ;-)
Greetings from Germany!