Chart is courtesy of marketclub.
Marketclub - Gold Spot Trend Analysis
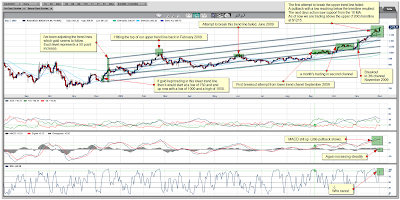
Since I did my last chart I've been doing some minor adjustments to my trend lines. Only minor ones as you'll see. Just compare the two daily charts for a moment.
Only difference is, the trend lines now align perfectly and every other one is 50 points away from the next one. I don't know whether this is a coincidence to have them lining up so perfectly but there are too many points to highlight on the chart which sorta rules out coincidence...at least to me.
For instance...the bottom trend line started November/ December 2008 at around 750 (low to be exactly 756,20 at December 07, 2008). Were we to follow that trend line until now we would indeed with the combined normal trading action have hit the 1000 mark around September / October 2009.
Also from the chart you will see the upper trend line being hit in February 2008, on February the 20th to be precise. If I use that high and draw a new trend line parallel with my other trend line and also at exactly 50 points from the lower one (the 4th), take a look where gold took a breather from a couple days ago!
On November the 24th I posted an alert on my stock-house blog to let my readers know that a possible dip was coming. You can now see why!
Sure, it could break the upper trend line straight away but always better to take some profits off the table. That way you have some funds available to buy stocks on the low if it does turn down.
On with the chart, you'll see that from the beginning of November gold has broken through several trend lines, three to be precise. Now, if you know that each channel represents 50 points than that gives you 3 x 50 which equals 150 points increase already since the beginning of November when we were still trading at 1050.
So, starting from 1050 in early November, 3 channels up gives us 1200. Now from the chart you'll clearly see that it broke short of the 1200 and after hitting 1195 started trading down. It was a quick pullback which coincided with the Dubai debt issue seemed like a very violent correction as it went down and hit a low of 1136, a little bit under the lower trend line. Gold was quickly brought back up again and together with the 10 MA as support was quickly making its way to the upper most trend line again and has since yesterday clearly broken it.
 Trading now around $1215, so definitely above the upper trend line which sorta leaves me wondering where this is going to end? In my last article I indicated getting to 1200 would be no problem. From the looks of things I'd say no problem indeed!
So now what?
Well, from the chart you'll see already on the daily we are a whopping $232 away from the Moving Average 200 ;-)
Don't know if this is a record or not since my charts only go back for 10 years but from what I can see on the daily in those 10 years....IT IS!!!
Does that mean I'm now looking downwards for gold? HECK NO!
No time to be betting against gold right now, no matter what RSI or MA tells you. At least, that's what I think. If mean, if you see gold moving up channel after channel, gaining 50 points in a couple of days and another 100 points over the course of less than a month with no signs of even looking back to the carnage it is wreaking havoc upon amongst those who are short.
Golden HAVOC!
So, does the daily chart please YeOldGoldNugget? A WHOLEHEARTEDLY YES! It is the relentless action of gold, the maybe historic gains gold is making now. Not simple factors to ignore, my 2 gold nuggets.Gold Spot Weekly Chart
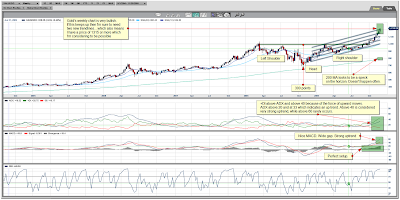
Chart is courtesy of marketclub.
Marketclub - Gold Spot Trend Analysis
Weekly is where gold does its magic! Is it magical? Well, can't you see the magic going on in the weekly chart? I sure can!
Again, mind you, I can only look back 10 years in market club and from what I can see gold has never seen such strong performance like it has these last two months. Absolutely amazing to say the least!
From the chart you can see we are still or could still be completing our head and shoulders pattern which we broke out off from the beginning of October 2009, That alone gives us a long term price indication of about 1300 to 1350.
Looking at the MACD,...if ever someone needed to write a book and describe one of the most bullish of MACD's then surely gold's MACD or something similar would be shown. Blue line above red line, wide gap ever increasing, steady increase is also shown in the gray divergence cubes which increase steadily over time. That is just what one needs to see and will always see when a stock or index is undergoing a strong uptrend.
I've added another indicator, the Average Directional Index, this can determine trend strength regardless of the market direction. This non-directional oscillator is based on a range of 1 to 100 (although movements over 60 are rare). If the line is under the 20 mark, the trend is considered to be weak. If the line is above the 40 mark, the trend is considered to be strong. The ADX line is built on the results of two separate technical indicators, the +DI (force of up-moves) and the –DI (force of the down-moves). The default for this study is 14 periods which takes into the consideration the measurements of the +DI and –DI for the last 14 periods.
Knowing that and looking at gold's ADX chart you can clearly see the +DI above the ADX which indicates a trend upwards. ADX is also looking to go higher.
 If gold keeps up its relentless action which it, looking at the weekly chart, is bound to do then by February 2010 we might already be looking at 1300 or more.
Stranger things have happened.
I think we have a clear winner here! Gold...and silver...bound to astonish most and catch many off-guard and with their pants down.
To finish my article I'll give a couple supports daily and weekly.
On the daily we have support from either the 10 MA at 1184, the 30 MA at 1129. I'm disregarding the 200 MA (984) for obvious reasons. Of course, there are also the trend lines to look for to offer support, 1200, 1150, 1100,...
On the weekly we have support (and also from the trend lines) from either the 10 MA at 1096, the 30 MA at 1002. I'm disregarding the 200 MA (788) for obvious reasons.
YeOldGoldNugget's links of interest
- New Video: Key Levels to Watch in the S&P 500
- New Video: The gold market continues to steam roll ahead!
- New Video: A look at the dollar index
- New Video: What do supertraders have in common
- New Video: Two Major Forces Collide in the Index Markets
- New Video: What’s Gold’s Next Stop?
- New Video: How long will Dow stay Bullish?
- New Video: Has Gold Topped Out for the Year?
- Has the S&P Index Topped Out for the Year?
- CRB Index insight video
- Are You Laughing or Crying About Markets?
- Introducing the Perfect Portfolio
- What does winter hold for Crude Oil?
- Free Email Trading Course Copy
- New Video: ETF GLD is analyzed


![Live 24 hours silver chart [ Kitco Inc. ]](http://www.kitco.com/images/live/silver.gif)


.png)








No comments:
Post a Comment
Make new friends but keep the old ones, one is silver and the other is gold.
Although gold and silver are not by nature money, money is by nature gold and silver.
With those quotes, YeOldGoldNugget invites you to post a comment.